Logcat

В Android SDK входит набор инструментов, предназначенных для отладки. Самый важный инструмент при отладке — это LogCat (очень красивое название, которое можно перевести как Логичный Кот). Он отображает сообщения логов (журнал логов), рассылаемые при помощи различных методов.
Рассмотрим на примере. Очень часто программисту нужно вывести куда-то промежуточные результаты, чтобы понять, почему программа не работает. Особо хитрые временно размещают на экране текстовую метку и выводят туда сообщение при помощи метода textView.setText(«Здесь был Васька»). Но есть способ лучше. В Android есть специальный класс android.util.Log для подобных случаев.
Класс android.util.Log позволяет разбивать сообщения по категориям в зависимости от важности. Для разбивки по категориям используются специальные методы, которые легко запомнить по первым буквам, указывающие на категорию:
- Log.e() — ошибки (error)
- Log.w() — предупреждения (warning)
- Log.i() — информация (info)
- Log.d() — отладка (degub)
- Log.v() — подробности (verbose)
- Log.wtf() — очень серьёзная ошибка! (What a Terrible Failure!, работает начиная с Android 2.2)
- Log.meow() — когда жрать дадут? (MEOW!) Недокументированный метод, используйте на свой страх и риск. Работает не на всех устройствах
В первом параметре метода используется строка, называемая тегом. Обычно принято объявлять глобальную статическую строковую переменную TAG в начале кода:
Некоторые в сложных проектах используют следующий вариант, чтобы понимать, в каком классе происходит вызов:
Далее уже в любом месте вашей программы вы вызываете нужный метод журналирования с этим тегом:
Также используется в исключениях:
Пользователи не видят этот журнал. Но, вы, как разработчик, можете увидеть его через программу LogCat, доступный в Android Studio.
Полный вид сообщения выглядит следующим образом.
03-09 20:44:14.460 3851-3879 / ru.alexanderklimov.cat I/OpenGLRenderer : Initialized EGL, version 1.4
- 03-09 20:44:14.460 Date/Time
- 3851-3879 Process & Thread IDs
- ru.alexanderklimov.cat Package name
- I/OpenGLRenderer Tag
- Initialized EGL, version 1.4 Message
Подобные длинные сообщения не всегда удобны для чтения. Вы можете убрать ненужные элементы. Для этого выберите значок LogCat Header в виде шестерёнки и уберите флажки у опций.

В LogCat вы можете отфильтровать сообщение по заданному типу, чтобы видеть на экране только свои сообщения. Для этого выберите нужный тип тега из выпадающего списка Verbose.
Типы сообщений можно раскрасить разными цветами через настройки File | Settings | Editor | Colors Scheme | Android Logcat.
Для отслеживания сообщений с заданным текстом введите в поле поиска нужную строку и нажмите Enter.
Также активно используйте варианты из других выпадающих списков. Например, выбирайте свой пакет из второй колонки, а в последней выбирайте Show only selected application. Для более точной настройки используйте Edit Fiter Configuration.

По умолчанию, окно LogCat выводится в нижней части студии. При желании, можно выбрать другие варианты через значок настроек окна.
LogCat также можно запустить из командной строки:
Параметры командной строки смотрите в документации.
Быстрое отключение журналирования
Настоятельно рекомендуется удалять все вызовы LogCat в готовых приложениях. Если проект очень большой и вызовы журналирования разбросаны по всем местам кода, то ручное удаление (или комментирование) становится утомительным занятием. Многие разработчики используют следующую хитрость — создают обёртку вокруг вызова методов LogCat.
Теперь остаётся только присвоить нужное значение переменной isDebug перед созданием готового apk-файла для распространения.
Способ устарел. В 17-й версии Android Build Tools появился класс BuildConfig, содержащий статическое поле DEBUG. Можно проверить следующим образом:
Способ для продвинутых — например, требуется релиз с выводом в лог, или наоборот — debug с выключенным выводом. В этом случае можно создать собственный параметр и добавить его в секцию buildType gradle-файла:
В этом случае конфигурация releaseWithLog будет являться релизной сборкой с ведением логов. Естественно, в коде слегка поменяется проверка:
LogCat на устройстве
Попался в сети пример для просмотра сообщений LogCat на устройстве. С примером не разбирался, оставлю здесь на память.
Источник
Полный список
В этом уроке мы:
— рассмотрим логи приложения и всплывающие сообщения
Project name: P0121_LogAndMess
Build Target: Android 2.3.3
Application name: LogAndMess
Package name: ru.startandroid.develop.logandmess
Create Activity: MainActivity
Создадим в main.xml экран, знакомый нам по прошлым урокам про обработчики:
Алгоритм приложения будет тот же. По нажатию кнопок меняется текст. Обработчик — Activity.
Сохраним, запустим. Убедимся, что все работает.
Логи приложения
Когда вы тестируете работу приложения, вы можете видеть логи работы. Они отображаются в окне LogCat. Чтобы отобразить окно откройте меню Window > Show View > Other … В появившемся окне выберите Android > LogCat

Должна появится вкладка LogCat

Рассмотрим эту вкладку подробней. Логи имеют разные уровни важности: ERROR, WARN, INFO, DEBUG, VERBOSE (по убыванию). Кнопки V D I W E (в кружках) – это фильтры и соответствуют типам логов. Опробуйте их и обратите внимание, что фильтр показывает логи не только своего уровня, но и уровней более высокой важности. Также вы можете создавать, редактировать и удалять свои фильтры – это мы рассмотрим чуть дальше.
Давайте смотреть, как самим писать логи. Делается это совсем несложно с помощью класса Log и его методов Log.v() Log.d() Log.i() Log.w() and Log.e(). Названия методов соответствуют уровню логов, которые они запишут.
Изменим код MainActivity.java. Возьмем все каменты из кода и добавим в DEBUG-логи с помощью метода Log.d. Метод требует на вход тэг и текст сообщения. Тэг – это что-то типа метки, чтобы легче было потом в куче системных логов найти именно наше сообщение. Добавим описание тега (TAG) и запишем все тексты каментов в лог.
Eclipse ругнется, что не знает класс Log. Обновите импорт (CTRL+SHIFT+O) и, если спросит, выберите android.util.Log. Запустим приложение, понажимаем кнопки и посмотрим логи

Видно, что все отлично записалось. Чтобы сделать просмотр удобней, создадим свой фильтр. Жмем значок +

Имя фильтра произвольное, например, «My logs». Log Tag – это как раз значение константы TAG, которая описана в нашем коде и использовалась в методе Log.d, т.е. — «myLogs«. Pid оставляем пустым, это id процесса. Уровень поставим Debug

и жмем OK. Появилась новая вкладка My logs, на которой отображаются логи, соответствующие только что созданному фильтру.
Мы помещали в лог текст, но разумеется, вы можете писать, например, значения интересующих вас переменных (приведенные к типу String).
Иногда бывает, что логи не отображаются во вкладке LogCat, хотя AVD запущен, приложение работает без проблем. В таком случае должно помочь следующее: в Eclipse идем в меню Window > Open Perspective > Other > DDMS. Откроется немного другой набор окон чем обычно. Там найдите вкладку Devices и в ней должно быть видно ваше AVD-устройство, кликните на него и логи должны появиться. Чтобы вернуться в разработку: Window > Open Perspective > Java.
Всплывающие сообщения
Приложение может показывать всплывающие сообщения с помощью класса Toast. Давайте подредактируем метод onClick. Сделаем так, чтобы всплывало сообщение о том, какая кнопка была нажата.
Разберем синтаксис вызова. Статический метод makeText создает View-элемент Toast. Параметры метода:
— context – пока не будем вдаваться в подробности, что это такое и используем текущую Activity, т.е. this.
— text – текст, который надо показать
— duration – продолжительность показа ( Toast.LENGTH_LONG — длинная, Toast.LENGTH_SHORT — короткая )
Toast создан и чтобы он отобразился на экране, вызывается метод show(). Сохраняем, запускаем, проверяем.

Если у вас есть Андроид-смартфон, я думаю вы уже видели подобные сообщения. Теперь вы знаете, как это делается )
На следующем уроке:
— создаем пункты меню
Присоединяйтесь к нам в Telegram:
— в канале StartAndroid публикуются ссылки на новые статьи с сайта startandroid.ru и интересные материалы с хабра, medium.com и т.п.
— в чатах решаем возникающие вопросы и проблемы по различным темам: Android, Kotlin, RxJava, Dagger, Тестирование
— ну и если просто хочется поговорить с коллегами по разработке, то есть чат Флудильня
— новый чат Performance для обсуждения проблем производительности и для ваших пожеланий по содержанию курса по этой теме
Источник
Android Debug Log
One very common trick developers use to debug their applications is to make calls to Console.WriteLine . However, on a mobile platform like Android there is no console. Android devices provides a log that you can use while writing apps. This is sometimes referred to as logcat due to the command that you type to retrieve it. Use the Debug Log tool to view the logged data.
Android Debug Log Overview
The Debug Log tool provides a way to view log output while debugging an app through Visual Studio. The debug log supports the following devices:
- Physical Android phones, tablets, and wearables.
- An Android Virtual device running on the Android Emulator.
The Debug Log tool does not work with Xamarin Live Player.
The Debug Log does not display log messages that are generated while the app is running standalone on the device (i.e., while it is disconnected from Visual Studio).
Accessing the Debug Log from Visual Studio
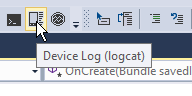
To open the Device Log tool, click Device Log (logcat) icon on the toolbar:
Alternately, launch the Device Log tool from one of the following menu selections:
- View > Other Windows > Device Log
- Tools > Android > Device Log
The following screenshot illustrates the various parts of the Debug Tool window:

Device Selector – Selects which physical device or running emulator to monitor.
Log Entries – A table of log messages from logcat.
Clear Log Entries – Clears all current log entries from the table.
Play/Pause – Toggles between updating or pausing the display of new log entries.
Stop – Halts the display of new log entries.
Search Box – Enter search strings in this box to filter for a subset of log entries.
When the Debug Log tool window is displayed, use the device pull-down menu to choose the Android device to monitor:

After the device is selected, the Device Log tool automatically adds log entries from a running app – these log entries are shown in the table of log entries. Switching between devices stops and starts device logging. Note that an Android project must be loaded before any devices will appear in the device selector. If the device does not appear in the device selector, verify that it is available in the Visual Studio device drop-down menu next to the Start button.
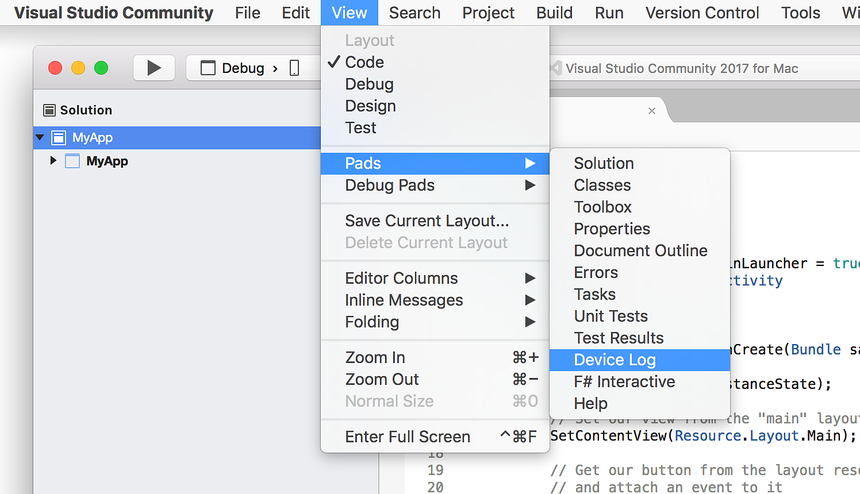
To open the Device Log, click View > Pads > Device Log:
The following screenshot illustrates the various parts of the Debug Tool window:
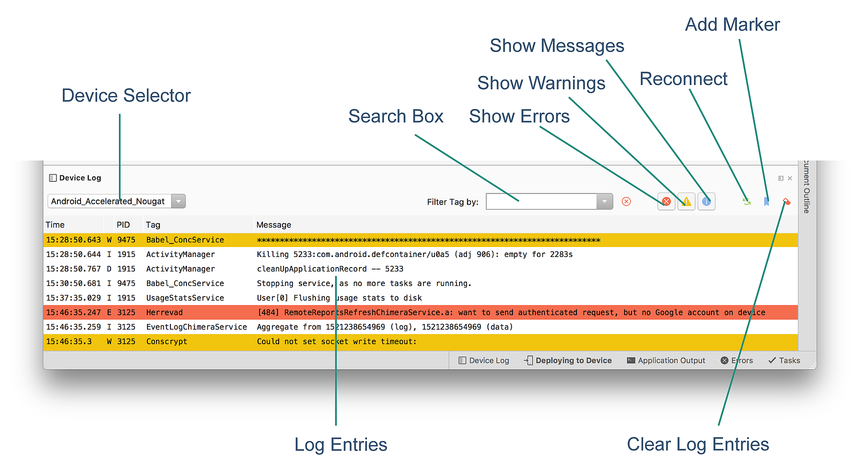
Device Selector – Selects which physical device or running emulator to monitor.
Log Entries – A table of log messages from logcat.
Clear Log Entries – Clears all current log entries from the table.
Search Box – Enter search strings in this box to filter for a subset of log entries.
Show Messages – Toggles the display of informational messages.
Show Warnings – Toggles the display of warning messages (warning messages are shown in yellow).
Show Errors – Toggles the display of error messages (warning messages are shown in red).
Reconnect – Reconnects to the device and refreshes the log entry display.
Add Marker – Inserts a marker message (such as — Marker N — ) after the latest log entry, where N is a counter that starts from 1 and increments by 1 as new markers are added.
When the Debug Log tool window is displayed, use the device pull-down menu to choose the Android device to monitor:
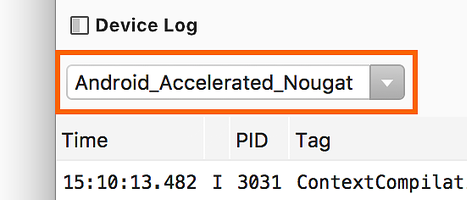
After the device is selected, the Device Log tool automatically adds log entries from a running app – these log entries are shown in the table of log entries. Switching between devices stops and starts device logging. Note that an Android project must be loaded before any devices will appear in the device selector. If the device does not appear in the device selector, verify that it is available in the Visual Studio device drop-down menu next to the Start button.
Accessing from the Command Line
Another option is to view the debug log via the command line. Open a command prompt window and navigate to the Android SDK platform-tools folder (typically, the SDK platform-tools folder is located at C:\Program Files (x86)\Android\android-sdk\platform-tools).
If only a single device (physical device or emulator) is attached, the log can be viewed by entering the following command:
Another option is to view the debug log via the command line. Open a Terminal window and navigate to the Android SDK platform-tools folder (typically, the SDK platform-tools folder is located at /Users/username/Library/Developer/Xamarin/android-sdk-macosx/platform-tools).
If only a single device (physical device or emulator) is attached, the log can be viewed by entering the following command:
If more than one device is attached, the device must be explicitly identified. For example adb -d logcat displays the log of the only physical device connected, while adb -e logcat shows the log of the only emulator running.
More commands can be found by entering adb and reading the help messages.
Writing to the Debug Log
Messages can be written to the Debug Log by using the methods of the Android.Util.Log class. For example:
This produces output similar to the following:
It is also possible to use Console.WriteLine to write to the Debug Log – these messages appear in logcat with a slightly different output format (this technique is particularly useful when debugging Xamarin.Forms apps on Android):
This produces output similar to the following in logcat:
Interesting Messages
When reading the log (and especially when providing log snippets to others), perusing the log file in its entirety is often too cumbersome. To make it easier to navigate through log messages, start by looking for a log entry that resembles the following:
In particular, look for a line matching the regular expression that also contains the name of the application package:
This is the line which corresponds to the start of an activity, and most (but not all) of the following messages should relate to the application.
Notice that every message contains the process identifier (pid) of the process generating the message. In the above ActivityManager message, process 12944 generated the message. To determine which process is the process of the application being debugged, look for the mono.MonoRuntimeProvider message:
This message comes from the process that was started. All subsequent messages that contain this pid come from the same process.
Источник


