- @kov4l3nko
- Debugging Android third-party Java apps with native methods
- Prerequisites
- Preparations
- How to debug
- Links
- Wanna say something?
- Add C and C++ code to your project
- Download the NDK and build tools
- Create a new project with C/C++ support
- Build and run the sample app
- Create new C/C++ source files
- Additional resources
- Codelabs
@kov4l3nko

Debugging Android third-party Java apps with native methods
This guide is the last part of the series about third-party Android code debugging:
Prerequisites
Check your Android device:
- The device is rooted.
- You have access to Android console as root (with adb shell su or via SSH with SSHDroid).
- SuperSU may be needed to allow gdbserver and/or SSHDroid run as root (it depends on the device/ROM).
gdbserver for the Android device CPU arch is copied to /data/gdbserver/ . Usually, the proper gdbserver for your arch is under

“USB debugging” is enabled
Note! Most probably, you need one more step. Create a dedicated local directory on your Mac and copy /system/lib ( /system/lib64 for 64-bit devices) from your Android device to the dedicated directory. In other words, make a local copy of Android /system/lib on your Mac.
- Android Studio installed.
- Android SDK Platform Tools installed. To check and install it if needed, go to Android Studio settings ➡ “Appearance & Behavior” ➡ “System Settings” ➡ “Android SDK” ➡ “SDK Tools” ➡ “Android SDK Platform Tools”.
Android Device Monitor (aka DDMS) works properly. To check it, run
If it does not run or stucks after start, downgrade JDK. To remove the current JDK, exec
It will print the JDK’s home directory, e.g.
Remove the JDK home directory (e.g. /Library/Java/JavaVirtualMachines/jdk-9.0.1.jdk/ ). If it doesn’t help, also remove
Old JDKs are in the Oracle archive (Oracle account is needed to download). At the moment, Android Device Monitor works with OS X High Sierra 10.13.2 and JDK 1.8.0_141, but it may be changed in the future.
The latest smalidea archive downloaded and installed to Android Studio according to the instruction in “Installation” section.
The latest JAR’s for smali and baksmali downloaded and placed to any suitable directory.
7zip installed (the simplest was is to install Homebrew and then run brew install p7zip in OS X Terminal).
The latest Android NDK installed
Also, you need a disassembler to disassemble/analyse .so libraries from your Android device (e.g. my devices have CPUs with Thumb/ARM, ARM64, or x86_64 architecture, so I use Hopper to disassemble .so libraries)
Recommendation! Two things to keep it simple:
Cover smali and baksmali JAR with shell scripts, e.g.
This allows you to use backsmali.sh . instead of java -jar path/to/baksmali-2.2.2.jar . . In this guide I’ll use backsmali.sh whatever possible.
No need to explain why this makes your life easier 🙂
Preparations
The main idea is to use two debuggers side by side:
- Android Studio debugger to debug Smali
- GDB to debug native code
Consider Skout app as an example:
Install the app from Google Play to your Android device and get the APK:
Run Android Studio and choose in the main menu: “File” ➡ “New” ➡ “Import Project”. Choose the skout-for-debugging/ directory created at the previous step:

Click “Open”. Then choose “Create project from existing sources”:

Click “Next”. On the next step, check if the “Project location” path is correct (it must point to your skout-for-debugging/ directory):

Click “Next”. Wait while Android Studio is inspecting the directory, then make sure that skout-for-debugging directory is checked:

Click “Next”. Wait while Android Studio is looking for appropriate frameworks (it will not find any). Get the message

and click “Finish”. Wait while Android Studio is indexing files, then, in the left panel, choose “Project ➡ Project Files”:

Mark the skout-for-debugging/smali-src/ directory as the sources root:

In the main menu of Android Studio, click “Run” ➡ “Edit Configurations…” ➡ “+” ➡ “Remote”:

On “Configuration tab”, change “Port” to 8700 :

Connect your Android device to the Mac via USB, open your Android device console (with adb shell su or SSHDroid as root # ). Find the package of your app with pm list packages , e.g. for Skout
Find the main activity for the app. You can run the app as usual and use am stack list command to list activities
If am does not support stack list option on your device/ROM, look at the decompiled Smali code (for Skout, the code is in skout-for-debugging/smali-src/ ) and find the main activity youself.
Kill the app process, e.g. tap “Settings” ➡ “Applications” ➡ tap the app ➡ “Force stop”, or use ps and kill in the Android console.
In the Android console, run
The resutl should look similar to

Switch to Android Studio, find the main activity class and set breakpoints at
For the Skout app, it looks like

Run Device Monitor on the Mac, and select the app on the “Devices” tab:

Note! Keep Android Device Monitor open until you finished debugging the app! Also, the app must be selected in Android Device Monitor while you are debugging the app!
Switch back to Android Studio. In the main menu, click “Run” ➡ “Debug ‘Unnamed’”. As result, Android Studio must say
Connected to the target VM, address: ‘localhost:8700’, transport: ‘socket’

Also, the app must be marked with a green bug icon in Android Device Monitor:

Note! Alternatively, on step 4, you can specify an individual port instead of 8700 :

In this case you don’t need to keep Android Device Monitor open with the app selected.
If you have a local copy of Android /system/lib/ (see the note in the previous section), copy application .so libs from the Android device to the same local folder on your Mac (with adb pull or, if you use SSH, scp ). For Skout, the libs are in /data/data/com.skout.android/lib/ .
In the Android device console, attach gdbserver to the Skout process:
is the pid of the process (find it with ps | grep Skout ).
On the Mac, run gdb and execute the commands in GDB console:

Research the Smali code, find native methods declaration and loadLibrary calls, e.g. with regular expressions:
Breakpoint the loadLibrary and native method calls your are interested in.
Use a disassembler on your Mac to research the native libraries you copied from the Android device to the local folder (see step 12), find the functions implementing the native methods you are interested in. Breakpoint the functions in GDB.
Ready for debugging!
Note! If you do not create a local copy of /system/lib/ (see the note in the previous subsection), you don’t need step 12 and set solib-search-path . GDB command on step 14. However, as result, you may get system/app libraries without any symbols.
How to debug
The debugging is simple:
Continue process in GDB console
Continue process in Android Studio
Some breakpoints in the main activity class hit. Now you are able to debug Smali code from the very beginning. You can set breakpoints in Android Studio, trace Dalvik instructions, inspect/change class fields etc:

However, you can’t see Smali registers v0, v1, . and p0, p1, . in “Variables”. To see registers, use “Evaluate expression”:

Even in this case, you’re not able to change the registers.
Do something to trigger native library loading and/or calling a native method you are interested in. As result, the breakpoint on the native method call in Smali code hits.
Continue debugging in Android Studio, so the breakpoint on the corresponding function in native code hits in GDB. Now you can debug the native code with GDB.
Note! Android Studio debugging is frozen while you are debugging native code in GDB. So do not forget to continue executing native code with (gdb) c in GDB console.
Links
Wanna say something?
Commenting is not available in this blog, but you can write me a letter or message. Please, note that English is not my native language. I’m sorry for mistakes/missprints, if any.
Источник
Add C and C++ code to your project
You can add C and C++ code to your Android project by placing the code into a cpp directory in your project module. When you build your project, this code is compiled into a native library that Gradle can package with your app. Your Java or Kotlin code can then call functions in your native library through the Java Native Interface (JNI). To learn more about using the JNI framework, read JNI tips for Android.
Android Studio supports CMake, which is good for cross-platform projects, and ndk-build, which can be faster than CMake but only supports Android. Using both CMake and ndk-build in the same module is not currently supported.
If you want to import an existing ndk-build library into your Android Studio project, learn how to link Gradle to your native library project.
This page shows you how to set up Android Studio with the necessary build tools, create a new project with C/C++ support, and add new C/C++ files to your project.
If instead you want to add native code to an existing project, you need to follow these steps:
- Create new native source files and add them to your Android Studio project.
- You can skip this step if you already have native code or want to import a prebuilt native library.
- Configure CMake to build your native source code into a library. You also require this build script if you are importing and linking against prebuilt or platform libraries.
- If you have an existing native library that already has a CMakeLists.txt build script, or uses ndk-build and includes an Android.mk build script, you can skip this step.
- Configure Gradle by providing a path to your CMake or ndk-build script file. Gradle uses the build script to import source code into your Android Studio project and package your native library (the SO file) into the app.
Once you configure your project, you can access your native functions from Java or Kotlin code using the JNI framework. To build and run your app, simply click Run .
Note: If your existing project uses the deprecated ndkCompile tool, you should migrate to using either CMake or ndk-build. To learn more, go to the section about how to Migrate from ndkCompile.
Attention experimental Gradle users: Consider migrating to plugin version 2.2.0 or higher, and using CMake or ndk-build to build your native libraries if any of the following apply to you: Your native project already uses CMake or ndk-build; you would rather use a stable version of the Gradle build system; or you want support for add-on tools, such as CCache. Otherwise, you can continue to use the experimental version of Gradle and the Android plugin.
Download the NDK and build tools
To compile and debug native code for your app, you need the following components:
- The Android Native Development Kit (NDK): a toolset that allows you to use C and C++ code with Android, and provides platform libraries that allow you to manage native activities and access physical device components, such as sensors and touch input.
- CMake: an external build tool that works alongside Gradle to build your native library. You do not need this component if you only plan to use ndk-build.
- LLDB: the debugger Android Studio uses to debug native code.
For information on installing these components, see Install and configure the NDK, CMake, and LLDB.
Create a new project with C/C++ support
Creating a new project with support for native code is similar to creating any other Android Studio project, but there is an additional step:
- In the Choose your project section of the wizard, select the Native C++ project type.
- Click Next.
- Complete all other fields in the next section of the wizard.
- Click Next.
- In the Customize C++ Support section of the wizard, you can customize your project with the C++ Standard field. Use the drop-down list to select which standardization of C++ you want to use. Selecting Toolchain Default uses the default CMake setting.
- Click Finish.
After Android Studio finishes creating your new project, open the Project pane from the left side of the IDE and select the Android view. As shown in figure 2, Android Studio adds the cpp group:
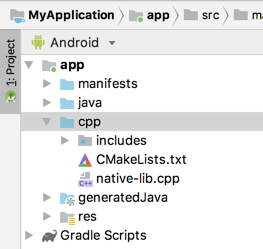
Figure 2. Android view groups for your native sources and external build scripts.
Note: This view does not reflect the actual file hierarchy on disk, but groups similar files to simplify navigating your project.
The cpp group is where you can find all the native source files, headers, build scripts for CMake or ndk-build, and prebuilt libraries that are a part of your project. For new projects, Android Studio creates a sample C++ source file, native-lib.cpp , and places it in the src/main/cpp/ directory of your app module. This sample code provides a simple C++ function, stringFromJNI() , that returns the string «Hello from C++». You can learn how to add additional source files to your project in the section about how to Create new native source files.
Similar to how build.gradle files tell Gradle how to build your app, CMake and ndk-build require a build script to know how to build your native library. For new projects, Android Studio creates a CMake build script, CMakeLists.txt , and places it in your module’s root directory. To learn more about the contents of this build script, read Configure CMake.
Build and run the sample app
When you click Run , Android Studio builds and launches an app that displays the text «Hello from C++» on your Android device or emulator. The following overview describes the events that occur in order to build and run the sample app:
- Gradle calls upon your external build script, CMakeLists.txt .
- CMake follows commands in the build script to compile a C++ source file, native-lib.cpp , into a shared object library and names it libnative-lib.so , which Gradle then packages into the app.
- During runtime, the app’s MainActivity loads the native library using System.loadLibrary() . The library’s native function, stringFromJNI() , is now available to the app.
- MainActivity.onCreate() calls stringFromJNI() , which returns «Hello from C++», and uses it to update the TextView .
Note: Instant Run is not compatible with components of your project written in native code.
If you want to verify that Gradle packages the native library in the app, you can use the APK Analyzer:
- Select Build > Build Bundles(s) / APK(s) > Build APK(s)
- Select Build > Analyze APK.
- Select the APK or AAB from the app/build/outputs/ directory and click OK.
- As shown in figure 3, you can see libnative-lib.so in the APK Analyzer window under lib// .

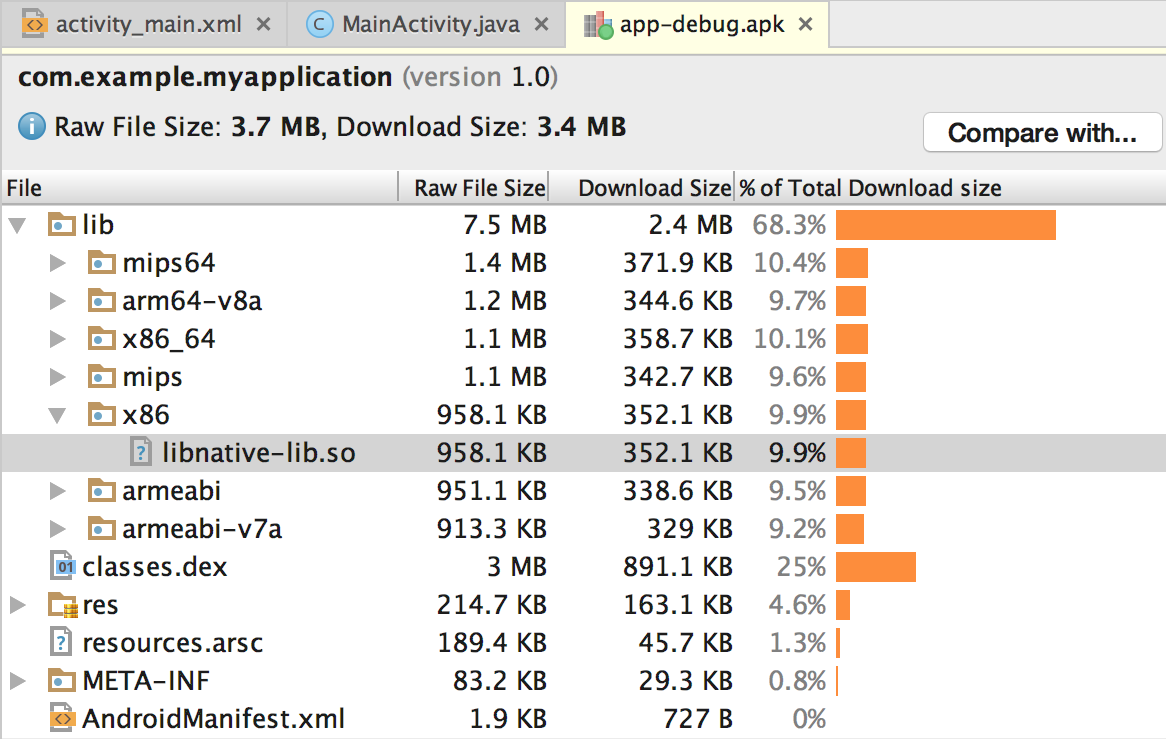
Figure 3. Locating a native library using the APK Analyzer.
Tip: If you want to experiment with other Android apps that use native code, click File > New > Import Sample and select a sample project from the Ndk list.
Create new C/C++ source files
To add new C/C++ source files to an existing project, proceed as follows:
- If you don’t already have a cpp/ directory in the main source set of your app, create one as follows:
- Open the Project pane from the left side of the IDE and select the Project view from the drop-down menu.
- Navigate to your-module > src, right-click on the main directory, and select New > Directory.
- Enter cpp as the directory name and click OK.
Right-click on the cpp/ directory and select New > C/C++ Source File.
Enter a name for your source file, such as native-lib .
- From the Type drop-down menu, select the file extension for your source file, such as .cpp .
- You can add other file types to the drop-down menu, such as .cxx or .hxx , by clicking Edit File Types . In the C/C++ dialog box that pops up, select another file extension from the Source Extension and Header Extension drop-down menus and click OK.
If you also want to create a header file, check the Create an associated header checkbox.
After you add new C/C++ files to you project, you still need to configure CMake to include them in your native library.
Additional resources
To learn more about supporting C/C++ code in your app, try the following resource.
Codelabs
- Create Hello-CMake with Android Studio, a codelab that shows you how to use the Android Studio CMake template to start Android NDK project development
Content and code samples on this page are subject to the licenses described in the Content License. Java is a registered trademark of Oracle and/or its affiliates.
Источник


