- Android vs iOS Users: Who are More Loyal? An in-Depth Analysis
- Marketing Strategies
- What does it mean to be loyal?
- Which brands are users interested in?
- Android users are more loyal, but…
- Android vs iOS: Current market shares
- Android loses more users than iOS
- Why is Apple doing so much better?
- App Download and Usage Statistics (2021)
Android vs iOS Users: Who are More Loyal? An in-Depth Analysis
Here’s an in-depth analysis of the loyalty data of Android and iOS users in detail. We’ll try to find out who wins or loses in the Android vs iOS battle.
With new smartphones becoming more and more expensive and inflation reducing the purchasing power of a large part of the population, choosing where to spend the money becomes more important than ever before. Meanwhile, from the manufacturer’s perspective, winning the loyalty of existing customers is a core part of the marketing strategy.
The two major mobile operating systems, Android and iOS, have been battling since their origins. Although the strategies may be different, the goal remains unchanged. So which OS has more loyal users? In the battle When it comes to the loyalty of Android vs iOS users, who wins the ground? Here’s an in-depth analysis.
Marketing Strategies
Major manufacturers are really good at marketing their products towards the correct customer segments: it’s not an easy task to convince people that your product is worth their salary. However, manufacturers also need to take into consideration customer satisfaction. It may sound strange, but the profit margins on a smartphone sale are some of the lowest in any industry. In some cases, storage options and official accessories are more profitable than the actual device.
If someone buys your device and he’s disappointed, that customer will avoid buying other products form your brand. Moreover, he will share his negative experience with his friends. People inside this network will be discouraged, which effectively transforms this into negative marketing. Keep in mind that people are inclined to give more importance to negative feedback than positive ones.
As a result, manufacturers need to create a product people will like, while still maintaining a good profit margin. A good product encourages customers to stay loyal to the brand. Moreover, it’s generally easier to sell something customers are already familiar with.
What does it mean to be loyal?
The answer is pretty simple but not obvious. Being loyal to something means that you keep choosing that thing over an alternative. The problem here is that iOS necessarily means Apple, or even more precisely, iPhone. In contrast, when you say Android, you could be talking about a great variety of brands. An Android user could remain loyal to the operating system while still switching to different manufacturers.
Let’s take a look at a survey conducted by Morgan Stanley and analyzed by Statista:
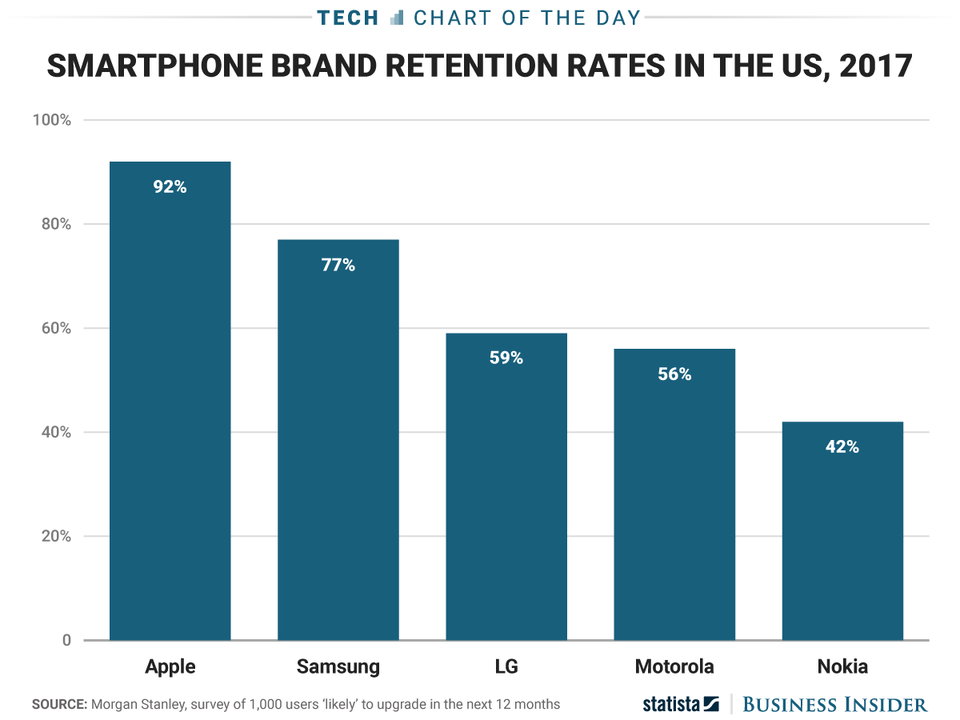
The survey has involved 1,000 users who were planning to upgrade their device within 12 months. They have been asked if they were satisfied with the current brand and if they would rather stick to it or switch to another one. From the chart, we can immediately see that 92% of iPhone users were planning to stay with Apple. Or better, as for the official report, “somewhat or extremely likely to stick to the brand“.
This doesn’t mean they were guaranteed to buy another Apple smartphone. Instead, we should read this graph as if we were talking about satisfaction rates. For this reason, it makes much more sense to think about disloyal users. In fact, we don’t know for sure if a satisfied user will stay with the same brand, but we can guess that a dissatisfied user will switch to a different brand as soon as possible.
Which brands are users interested in?
Horace Dediu (Twitter: @asymco) is well-known for sharing informative marketing and economy insights. In a recent tweet, we can find a very interesting table displaying the orientation of the customers towards various brands. Take a look at the following image:
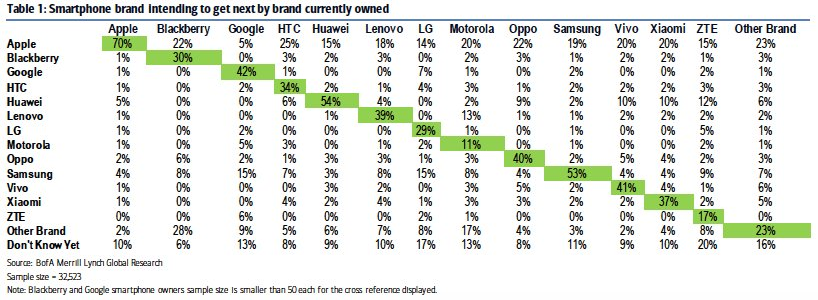
35,523 individuals have participated in this research. The columns show the current device, while the rows show the planned one. The green cells highlight the likeliness of staying with the current brand for the next purchase. At first look, it may seem that Apple has the highest loyalty rate. However, keep in mind that we’re comparing Android to iOS, rather than all manufacturers against each other.
One thing we can read is that interest in Apple products by users from other brands is very consistent. However, in most cases, users seem to be more inclined towards the brand they’re already using than anything else. Moreover, pricing often plays an important role in the final decision.
You should look at this information with a grain of salt. We don’t have accurate distribution numbers and intentions don’t always translate into action. However, the table gives us an insight into the thoughts of the analyzed demographic. In the next section, we’ll talk about the reason Android users are more loyal and why this doesn’t necessarily matter.
Android users are more loyal, but…
Various researches have revealed that Android users are more loyal than iOS ones. Just like in the previous cases, most of these studies have involved a limited number of samples. Everyone has his own way of thinking and believes his opinions are unique. However, scientific proofs such as Pareto’s Law (the 80 – 20 principle) or Zipf’s Law (distribution of rankings) show how predictable some behaviors can be. This reflects on the outcomes of different sample researches about a topic: most results are very similar to each other.
Now, after analyzing speculative insights, let’s take a look at some realistic customer retention data. The following report has been created by Consumer Intelligence Research Partners (CIRP). The information is based on official reports but also takes into consideration the responses of approximately 500 surveyed users in the U.S.
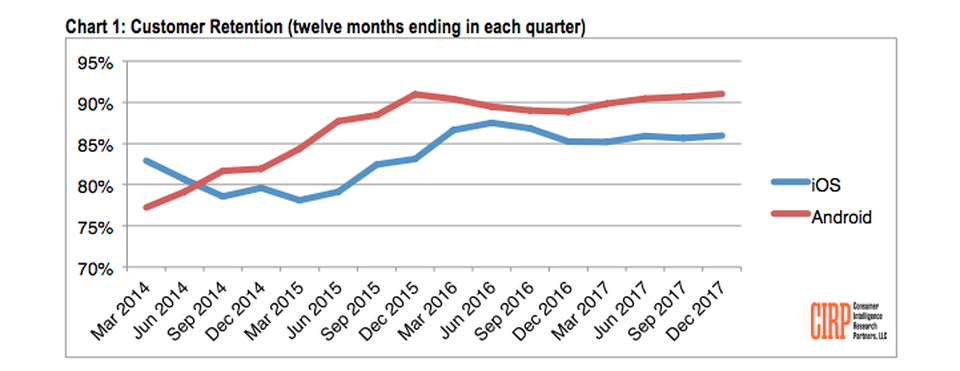
Let’s consider the 2 year period between December 2015 and December 2017, which appears fairly stable. It’s estimated that iOS loyalty has ranged between 85% and 88%, while Android retention rates have varied from 89% to 91%.
These are excellent results for both platforms, however, loyalty doesn’t take the lost users into consideration. The reason why this is a problem is that the number of iOS users is much lower than the number of Android users. Consequently, percentages, as shown in the last chart, have very different meanings. Before talking about numbers, we should get a better understanding of the market shares.
Android vs iOS: Current market shares
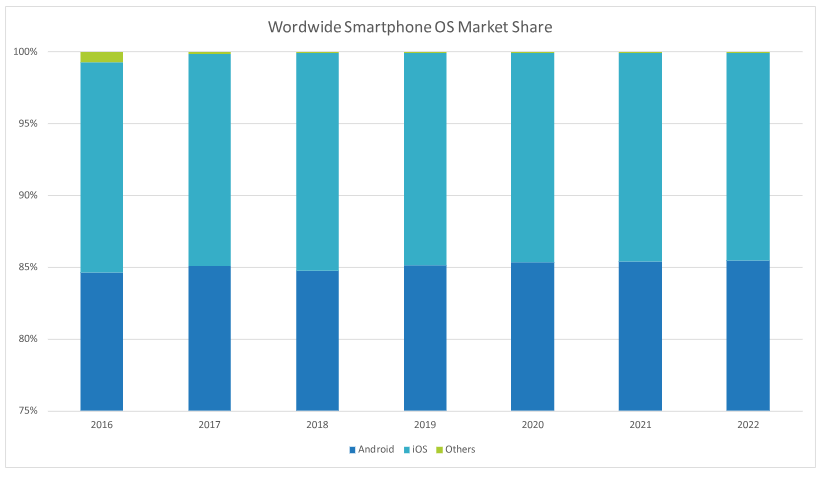
We already know that Android devices are much more diffused than iOS ones. I’ll tell you more, both Samsung and Huawei have more users than Apple. But how big they really are in comparison? For some indicative information, we’ll refer to the IDC reports. First of all, here are the market shares based on individual manufacturers:
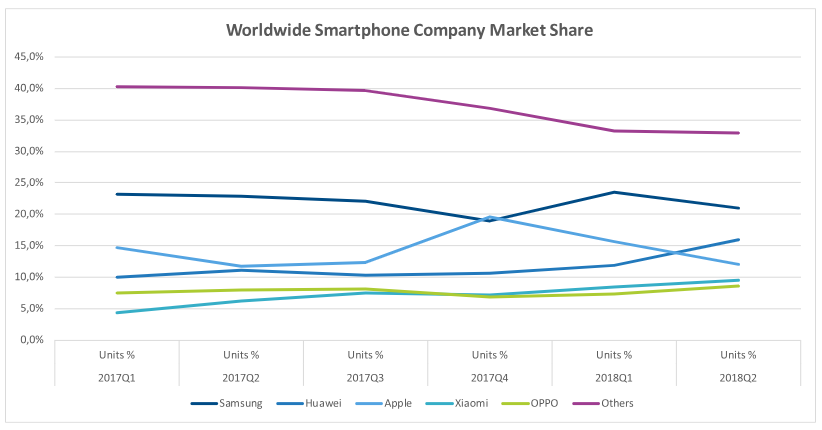
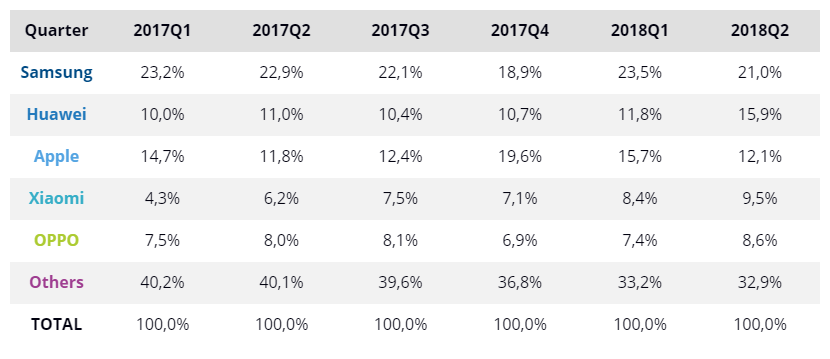
We can see that the market shares have changed a lot over the course of only 18 months. If we look at the same statistics under the operating systems‘ perspective, this is what we get:

Future shares have been speculated by experienced economists, however, the current and past information is pretty clear. You may start to understand that a single percentage point is much bigger when talking about Android. Now let’s go straight to the numbers.
Android loses more users than iOS
All the data you’ll find here have been approximated for easier understanding. It will be more enough to get an idea of the actual situation. For this analysis we’ll be referring to the 2017 period: during the year, Apple has sold 215.8 million iPhones, while the number reaches 1.244 billion for the Android manufacturers. Meanwhile, 14% of iOS users and 9% of Android users have switched to the other OS.
This means that 30 million iOS users have started using Android and 112 million Android users have purchased an iPhone. Now, we cannot be sure that the data we have is accurate. This research completely ignores the presence of people who use both operating systems. Moreover, the presence of traditional cell phones is pretty relevant. These devices are becoming very popular in developing countries thanks to the lower costs combined with new operating systems such as KaiOS.
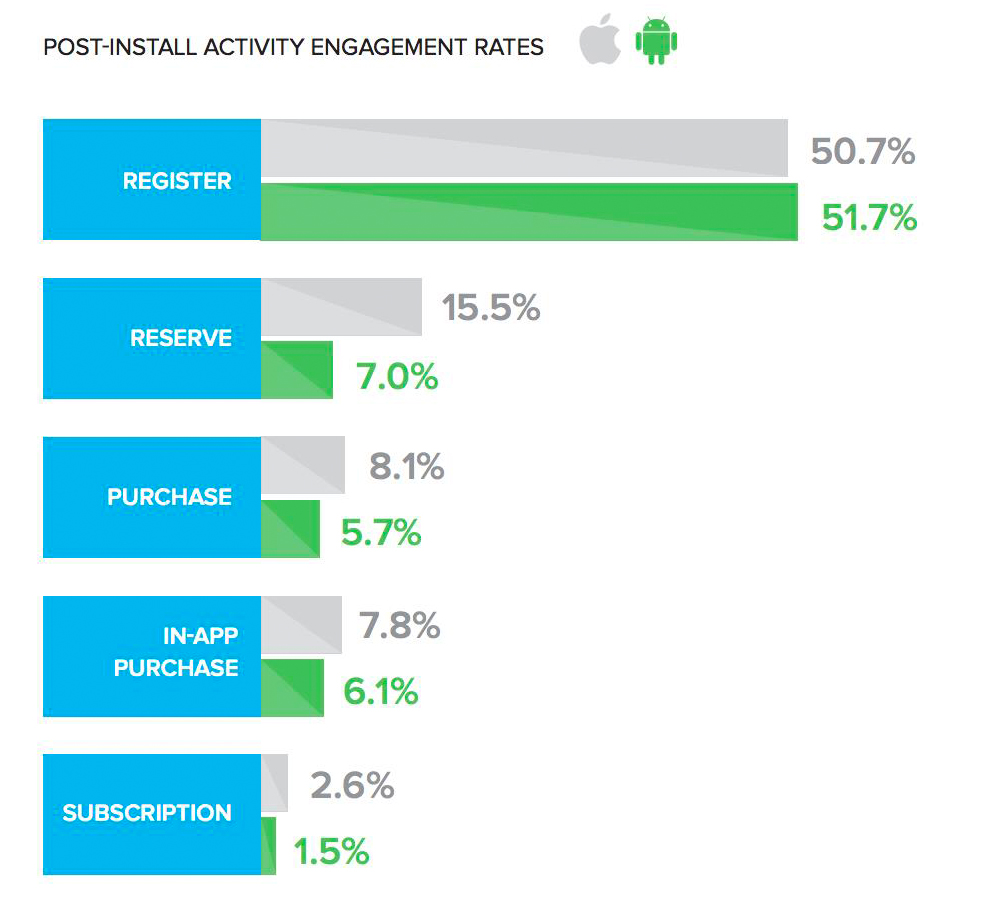
When it comes to the activity of the users of iOS and Android after installing apps, the latter appears to lose the grounds by a little margin in this regard too. According to the data published in Liftoff 2016 Mobile Index, the post-install engagement activity of the users of both the OSs differ.
Why is Apple doing so much better?
From Apple’s perspective, more Android users mean more opportunities. Moreover, many of them are already showing interest in iPhones. There are two major problems stopping them: unfamiliarity and pricing. Many people haven’t tried an iOS device before, and they’re afraid of the learning curve. In addition, Android users generally buy less expensive devices, with the latest flagships costing as much as a basic iPhone.
The way Apple wants to deal with this is pretty smart. First of all, their “Switch to iPhone” app allows users to automatically export most of their data, thus making the process easier. Secondly, they’re launching the iPhone XR at a more accessible price. Both these factors should encourage even more customers to move towards them.
For an iPhone user, switching to Android is a much harder task. Most data can be easily transferred nowadays, however, there are some inconveniences. First of all, you cannot transfer your App Store purchases. Secondly, all proprietary services such as iMessage or iCloud wouldn’t be accessible. Lastly, you would lose the integration with all other Apple products and accessories you may own.
The ecosystem is the reason Apple is so successful: it encourages you to buy first-party products and accessories that work perfectly together. Everything is projected to be simple and designed to look modern. Switching to Android becomes harder the more time you spend with it, but as a customer, you don’t care because you feel like they already offer everything you need. This is the real reason why the higher loyalty rates of Android don’t really matter – and loyalty is not why we love it that much.
Источник
App Download and Usage Statistics (2021)
Updated: November 10, 2021
The iOS App Store launched in 2008 with 500 apps. Today, 1.85 million different apps are available for users to download. Android users have even more from which to choose, with 2.56 million available through the Google Play Store.
These apps have come to play a huge role in the way we live our lives today. Through them, we can access pretty much the entire Western canon of music (and much beyond it too), meet romantic partners, and manage our diaries, documentation, and payments. Augmented reality apps are changing the way we interact with the world, and mobile gaming now accounts for lion’s share of games industry revenue.
Apps have also played a part during the coronavirus pandemic that has shaped 2020, helping to facilitate social distancing and contact tracing for example. And that is not to mention the crucial role they’ve played in allowing us to keep in touch with distant friends, family, and colleagues.
The market for these apps is about as big as they come. It is estimated that the global number of smartphone users will rise to 3.5 billion over the course of 2020. If we looked at it in terms of devices, there are more connected mobile devices in the world (7.94 billion) than there are people.
These devices are approaching ubiquity in advanced economies, among which median penetration levels stand at 76% of adults. In South Korea, a stunning 95% of adults own a smartphone.
Emerging economies are catching up. Brazil and South Africa already log penetration levels of 60%, while India’s lower figure of 24% still represents hundreds of millions of users.
Apptopia — App Market Intelligence Platform
Get accurate performance estimates for 3+ millions apps in 150+ countries. Make data driven decisions and optimize your app strategy.
These figures are growing every year, and along with it, the market for mobile apps. In the below report, we have gathered specific data relating to app downloads and usage. These are intended to give us a better idea of just how many apps are being downloaded every year, which of these are most popular, and how they are being used.
We have collected data and statistics on iOS and Android app downloads. Read on below to find out more.
Источник
