Monitor Network Requests and Responses on Android Studio

Dec 21, 2017 · 4 min read
Android Studio 3.0 has an improved Android Profiler. One nice addition in the profiler tool is that the network inspector added to Network section. Using that now we can see the network traffic originating from app in debug and see the responses as well. Those who were using Charles Proxy or similar tool will easily realise how convenient it is. We can get rid of one tool* and no more annoying HTTP proxy configuring and removing configuration after usage.
But there are few cat c hes. First thing is it will work only if you are using HttpURLConnection or OkHttp for network calls in your app. If you are using some other libraries for network request, probably you’ll get the following message on Network profiler
“Network Profiling Data Unavailable: There is no information for the network traffic you’ve selected.”
Second issue that you may face is that you might not be able to see the network request and response in all of your devices / emulators. You’ll need a device with API 26(Android 8.0) or above. Which is a serious issue for most of the developers. Android 8.0 is the latest release, and there are only very few actual devices running that. Many flagships are still awaiting Oreo update. Simulators are here to help. But how many of us really use AVDs? I personally don’t like it. They are still very slow(Definitely improved a lot in last few years)
Now let’s see how we can actually see the request-response in Android Studio and what are the things available in that
You’ll be familiar with the following Android Profiler window which sits normally at the bottom of Android Studio. And you’ll be using it once in a while or daily.
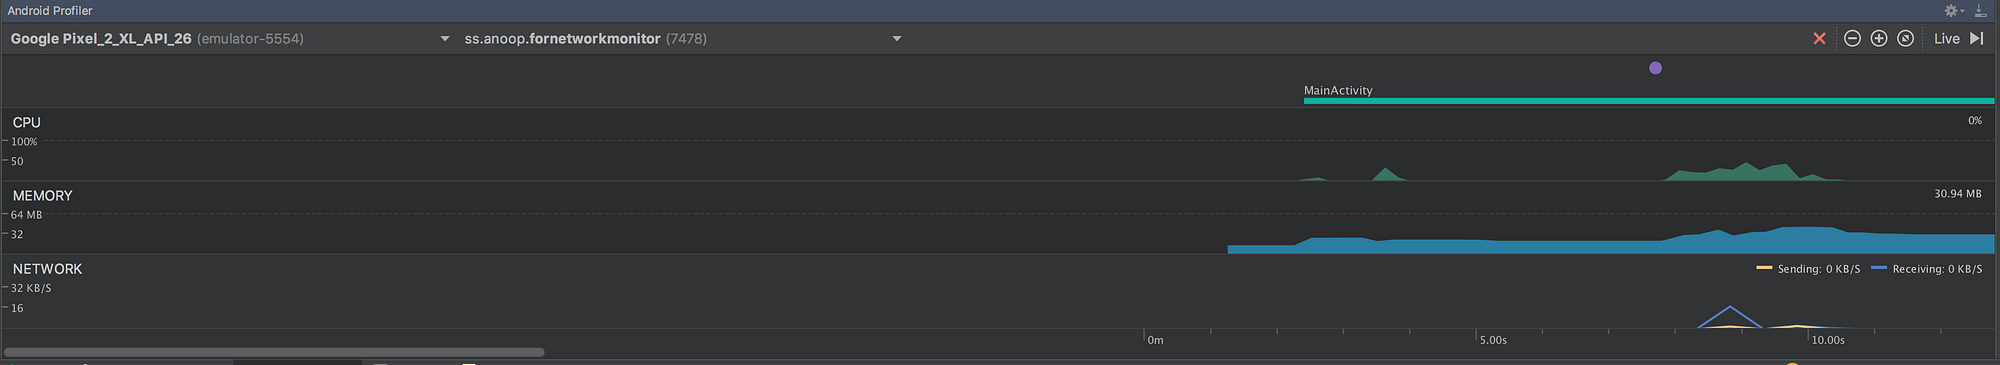
It have different profiler outputs like CPU, Memory, Network etc. Click on that network output which shows a blue and kind of orange spikes. It will expand to something like this.

The blue and orange spikes indicate received and send data respectively. So if you have a series of calls going on these spikes will be continuous. To see data that has been transferred between app and server. Select a particular region in the spike area. You can do this by dragging from start to end of the range. You’ll see something like this after selecting the area.
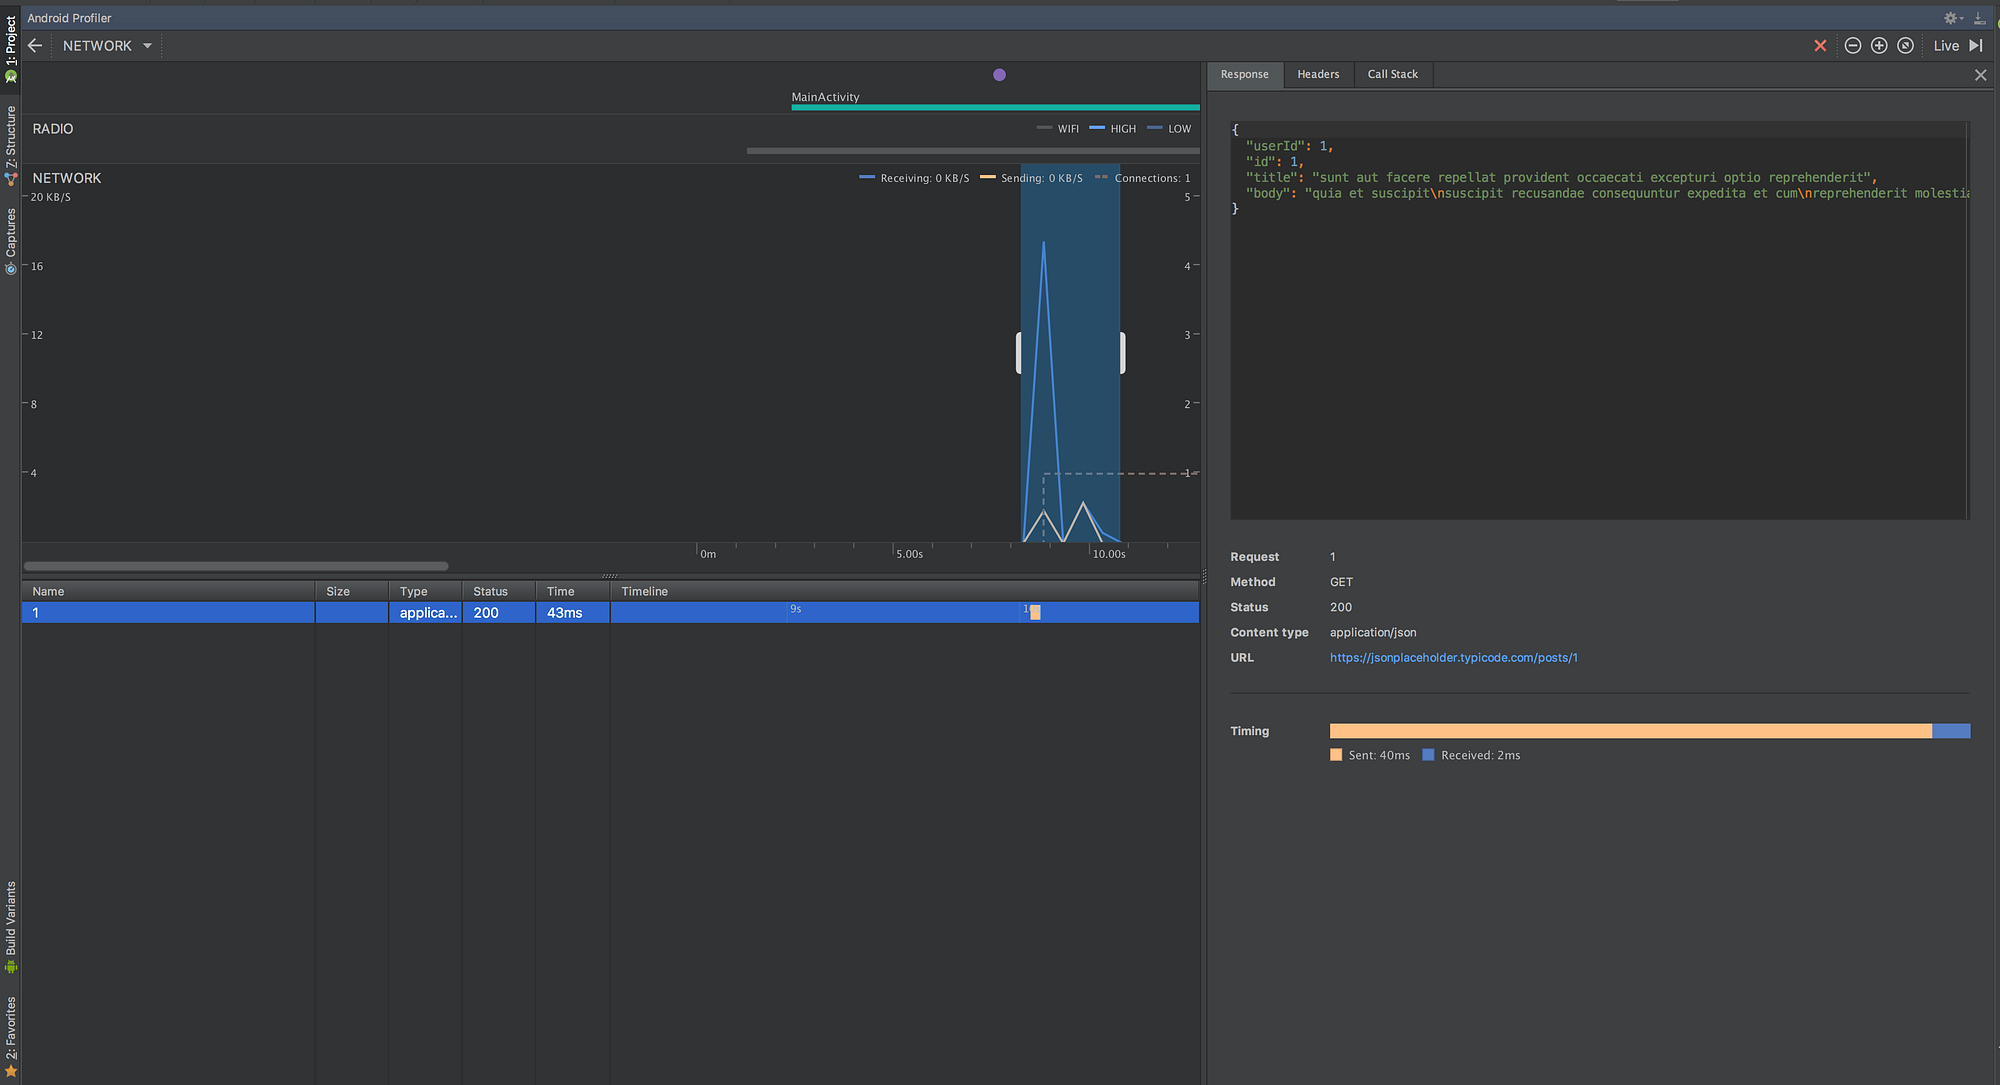
Here you can see a table below the spikes, thats the place where it lists the api calls happened between the selected range. On the right side the request response data, header etc can be inspected. In the above example name of the api is shown as one, because I have used a dummy api for this and the api was something like /posts/1.
I have tried to look into the network traffic generated from a webview. Profiler gave the default unavailable error message. I haven’t checked whether there are any tweaks to make it work. But my best guess is that it wont’t be showing data transfer originated from webviews. I will be updating that also when I have confirmation on that.
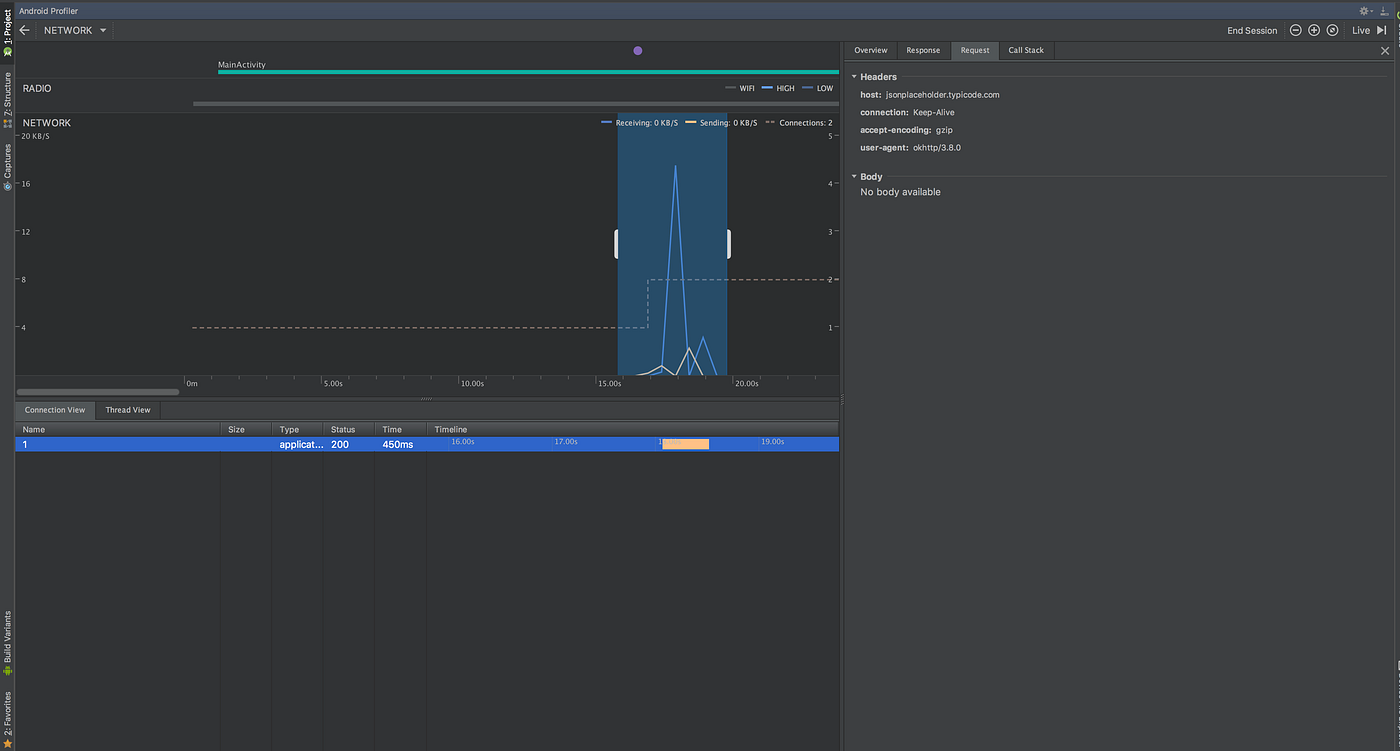
When Android Studio 3 was released the network monitor had the options only to view network responses and response headers. But no way to see the request params. But it is now available in the canary channel. Following is the screenshot of the above api response monitor example in Android Studio Canary 8 with request param option
So you might be wondering will it work only for API calls, or work with other web resources as well. I have tried monitoring the request and responses of image loading through some of the famous image loading libraries like Picasso, Glide, Fresco etch. Read more about it here.
Источник
Background Task Inspector

Android Studio includes multiple inspectors, such as the Layout Inspector and Database Inspector, to help you investigate and understand the internal state of your running app. With Android Studio Arctic Fox, we are releasing a new inspector to help you monitor and debug workers your app schedules using WorkManager 2.5.0 or higher.
WorkManager is the recommended way to run asynchronous tasks in the background, even after the app is closed. Although it’s easy to configure your tasks as WorkManager workers, once a worker is queued, its execution is difficult to monitor and tricky to debug if you face issues.
With the Background Task Inspector, you can easily monitor the status of a worker, see its relationship with other chained workers, or inspect details, such as the worker output, frequency, and other timing information. Let’s see what the Background Task Inspector can do on a sample project.
To demo the Background Task Inspector, I’ll use the WorkManager sample app in architectural-components repo. If you want to give it a try, you can check out the repo and follow along as you read the article.
This app uses WorkManager to apply user selected filters on the selected photo. After running the app, users can choose a photo from the gallery or simply use a random stock photo. To see how the Background Task Inspector works, I run the app and select an image to apply some filters.
Each filter is implemented as a WorkManager worker. After a short wait, the app displays the photo with the selected filters applied. Without any further knowledge on the sample app, let’s see what else I can figure out by just using the Background Task Inspector.
To open the Background Task Inspector, select View > Tool Windows > App Inspection from the menu bar.
With the Background Task Inspector tab selected in the App Inspection window, I run the app again on a device or emulator running API level 26 or above. If it is not automatically selected, I choose the app process from the drop-down menu. After connecting to the app process, I can then go to my running app and select all filters and click apply. This time I can see a list of running jobs in the Background Task Inspector.
The Background Task Inspector lists the class name, current state, start time, retries and the output data of all the running/failed or completed jobs. Clicking on a specific job from the list opens the work details panel.
This panel provides more detailed information for each worker’s description, execution, work continuation and the results. Let’s take a close look at each section.
Description section lists the Worker class name with the fully qualified package, as well as the assigned tag and the UUID of this worker.
Next, the execution section shows the worker’s constraints (if any), running frequency, it’s state and which class created and queued this worker.
WorkContinuation section displays where this worker is in the work chain. You can check the previous or the next worker, if any, or the other jobs in the work chain. You can click to another Worker UUID to navigate and see the selected worker’s details. Looking at this work chain, I can see that the app uses 5 different workers. The number of workers may differ depending on the choice of filters by the user.
This is great but imagining the work chain is not always easy if you are not familiar with the app. Another great feature of Background Task Manager Inspector is the ability to display the work chain as a graph. To do that I click the ‘Show in graph’ link in the WorkContinuation section or switch to Graph View by clicking the ‘show Graph View’ button on top of the jobs list.
This graph view can help you to understand the order of the workers, the data which is passed between workers and the current state of each worker.
The last section in the Work Details panel is the Results pane. In this section you can see the start time, retry count and the output data of the selected worker.
Let’s say I want to test what happens when a worker stops. To do that, I’ll run the app again, select the worker, wait until it changes to running state and click the ‘Cancel Selected Work’ on the top left. Once I do that, the worker I selected and the remaining workers in the chain change their status to canceled.
Graph view becomes even more useful if your app includes complex chaining relationships, such as the one here. The graph allows you to quickly see relationships between a complex set of workers and monitor their progress.
If you want to try the Background Task Inspector with a more complex graph or make some WorkManager art, you can find the code here and add the DummyWorkers to the continuation object as seen here.
Background Task Inspector will be available with Android Studio Arctic Fox release but it is already available for you to try in the Arctic Fox Preview channel and soon will be in beta! If your app uses Work Manager, please give a try and let us know what you think or simply share your WorkManager art with us!
Источник
Layout Inspector
Debugging UI hierarchies in Android Studio 4.0+
Debugging UI issues can be tricky. Android Studio 4.0 comes with an updated Layout Inspector that lets you debug your Android app UI (user interface) in a way that’s similar to Chrome dev tools. You can read along or if you prefer you can watch the video.
The Layout Inspector works with your device or the Android Emulator and displays the current view hierarchy. This helps pinpoint issues and discover the root causes. Unlike the previous version, the updated Layout Inspector can show the view hierarchy in a 3D perspective which lets you visually see how views are laid out. With this, you can inspect the view hierarchy in layers. It also shows all the view’s attributes including those inherited from its parents.
Let’s see how the latest version of the Layout Inspector works. To open the Layout Inspector click View and select Layout Inspector under the Tool Windows menu. This opens the Layout Inspector window.
The Layout Inspector only displays a UI hierarchy from a running process. This means you need to connect to a debuggable running app on a device or on an emulator. There are two ways to do this:
- If you don’t have a running process, connect to a device or start an Android Emulator instance and click run to start the app.
- If you have a running app process, click on select process, select your running device, and select your running app from the list under the selected running device.
After you select your app process, the Layout Inspector creates a snapshot of the current UI hierarchy. If you select the Live updates option, the snapshot is dynamically updated as you interact with the app on the device.
This version of the Layout Inspector resembles the previous version, but offers much more capability. To start with, the Layout Inspector can display the UI hierarchy two ways: in the usual 2D outline format, or in a 3D view called rotation mode.
Clicking the rotation button switches between the 2D and 3D view of the UI hierarchy. Clicking the rotation button switches between the two modes. When you are in rotation mode you can rotate the image of the UI hierarchy. Rotation helps you see how views are laid out. Note that rotation is only available on devices API level 29 and above.
You can also select a view and right-click to display only its children.
Similarly, you can display the parents of a selected view.
The pane on the right displays all of the declared and inherited attributes of the selected view. You can navigate to the layout’s corresponding xml file by clicking the link below any declared property. Like the rotation feature, this only works on devices running API level 29 or higher.
With the Layout Inspector, you can also load a new design and compare it to your current UI.
To load a design, click Load Overlay and select a design. After the image loads, you can change the alpha value of the overlay to see the difference between the current layout and the design.
Layout Inspector in Action
So far, we’ve seen how the Layout Inspector works, Now let’s see how it can help solve app issues. Here we have a simple sample app which consists of a fragment with some static content of text and an image.
If you want to try along while reading the post, follow the steps below first.
- Open Android Studio 4.0 and select New Project from File menu.
- Select Bottom Navigation Activity, click Next and click Finish.
- Replace contents of activity_main.xml and fragment_home.xml.
- Replace contents of HomeFragment.kt.
When you run the app, you’ll see a cute android — but there is something missing: the bottom navigation tabs. Looking at the layout file, we can verify that the bottom navigation view is present, but somehow it does not appear on the screen.

This looks like a good opportunity to try out the Layout Inspector! Let’s run the app and inspect this issue. Switching to rotation view after connecting to the app process reveals that there are problems with the app UI.
What we see first is that the toolbar is laid out inside the LinearLayout, which is followed by the navigation host. Below that, you see the navigation tabs at the very bottom. It looks like the bottom bar is pushed off the screen.
Maybe the size of the navigation host is wrong. Try setting the navigation host’s height to ‘wrap_content’:
Switching back to Layout Inspector, you can see that the linear layout has the correct size, but the bottom navigation tabs are not placed at the correct position:

There are different ways to fix this. We can add layout weights to the navigation host and the bottom navigation tabs, or we can switch to using constraint layout instead of linear layout but switching layouts is beyond the scope of this post. So let’s add layout weights:
And here is the result:

Voila! Now when we run the app, everything is in the right place.
Try out the new features of the Layout Inspector and let us know what you think! We are always looking to hear what you like, as well as issues you have or features that you would like to see.
Источник


