- CleanSoft
- Fast and clean software
- Debugging Android applications remotely
- Prerequisites
- Enabled remote debugging on the Android device with ADB
- Enable USB debugging on Android 4.2+ device
- Enabling ADB debugging over TCP/IP in local WiFi network
- Debugging over Internet
- Whitelisting remote machine for ADB debugging on Android 4.2+ device
- Connecting to your device over Internet
- Quick Guide To Remote Debugging Android 9 Pie Devices Using Chrome on Windows
- Step 1: Enable the Android Developer Options Menu
- Step 2: Enable USB Debugging on Android Device
- Step 3: Connect the Android Device to the Computer
- Step 4: Enable USB discovery in Chrome
- Step 5: Open the URL of the page to be debugged
- Step 6. Inspect the Page
- royshouvik / remoteDebugging.md
CleanSoft
Fast and clean software
Debugging Android applications remotely
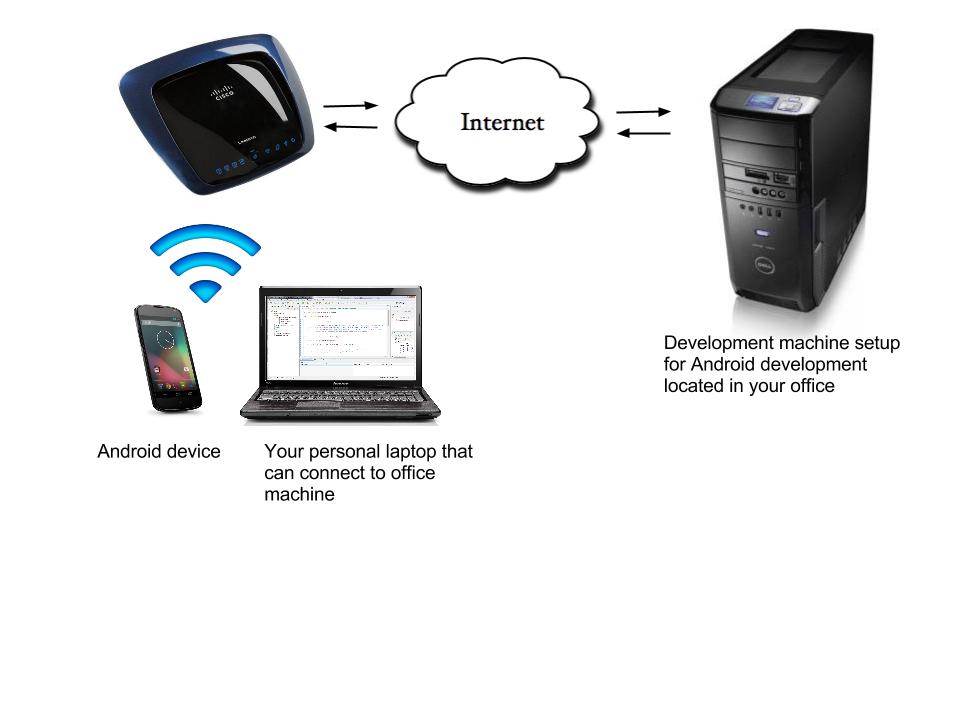
In this article we will try to setup Android device for remote debugging over the Internet. This will allow you to connect to your development machine from anywhere and debug your android apps on your device as it would be connected to your development machine using USB – run applications from IDE, debug and stop on breakpoints, view log cat output and basically everything that Android Debug Bridge allows.
In short here is what it looks like:
Prerequisites
- Android device with USB debugging enabled.
- WiFi network.
- Access to WiFi router to setup port forwarding.
- Computer with ADB tool installed and ability to connect Android device with USB cable – we will call it local machine.
- Computer with Android development environment that can be accessed remotely – remote computer
- Minimum version of ADB – 1.0.31
Enabled remote debugging on the Android device with ADB
We are using Android 4.2+ device for reference because additional steps are required to set it up. Devices with earlier versions of Android need to follow the same steps but omit security setup. We will start from the very beginning as if you never had your device connected to development machine. You probably already have some of steps completed so please skip them accordingly.
Enable USB debugging on Android 4.2+ device
On Android 4.2+ devices developer options are hidden by default. To reach USB debugging setting you need to enable it first.
- Go to Settings
- Tap on About Phone
- Now tap of Build number several times until you see a small popup with text You are now a developer.
Now go to Settings -> Developer Options and enable USB debugging.
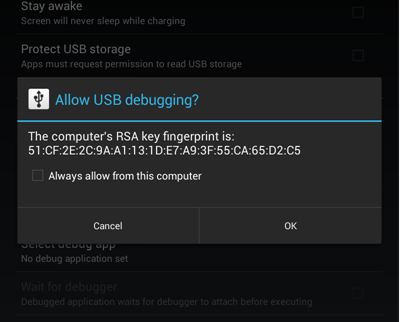
Now its time to connect to local computer for the first time. If you are using Android 4.2+ device you need to have ADB version 1.0.31 or greater. This is due security improvements which require you to whitelist all computers on your Android device before they can execute any of ADB commands. When you connecting to local computer using USB cable for the first time your Android 4.2+ device will prompt you if you want to allow connection.
You want to check Always allow from this computer and tap OK. This will place computer RSA public key on your device into /data/misc/adb/adb_keys folder and allow all subsequent connections.
Its important to make sure connection is successful before moving any further.
Type following commands in the shell:
- adb devices – should show “ XXXXXXXXXXXX device”, if you see “ XXXXXXXXXXXXXX offline ” this might mean that you have not allowed RSA key or have outdated ADB version (use adb version to make use you have at least 1.0.31 and SDK manager to update it).
- adb shell – should log you in in Android device shell
- grep ro.build.version.sdk= system/build.prop – displays SDK version
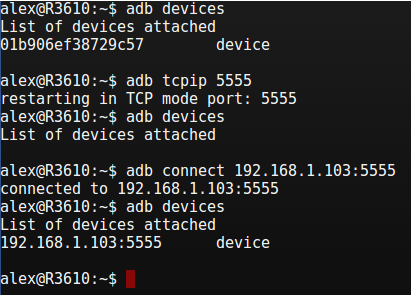
Successful output should looks like this
Enabling ADB debugging over TCP/IP in local WiFi network
Now its time to enable TCP/IP connection between you local computer and Android device. To set it up you need to know your device IP address. You can get it from your router or from adb shell netcfg command output while device is connected on USB.
- Keep device connected to USB
- Execute adb tcpip 5555 – will enable remote debugging on connected USB device
- Disconnect device from USB
- Execute adb connect :5555 – will connect to your device using WiFi network. It may take 10-15 seconds for Android to start accepting connections so be patient and try a few times if you see unable to connect message.
- Execute adb devices to check device status – should show :5555 device if connection is established successfully. Sometimes it shows offline when device is sleeping, try waking it up and retrying.
Debugging over Internet
Same requirements apply to your remote machine as for local machine – you need to have ADB version 1.0.31 and machine RSA key should be whitelisted on your Android 4.2+ device.
Whitelisting remote machine for ADB debugging on Android 4.2+ device
If your remote machine is not whitelisted on your Android device you can copy over ADB RSA key from the local machine to the remote one.
ADB RSA key is located here:
- Windows – %HOMEPATH%\.android
- Linux –
You need to get two files from your local machine and copy them over to you remote machine
Connecting to your device over Internet
- If adb on your local machine is still connected to device disconnect it with adb disconnect command
- Setup port forwarding on your router for port 5555. You need to forward all incoming traffic for port 5555 on the same port on your device.
- Find out your external IP by typing my ip in google – google search for ‘my ip’. If you have domain name linked to your IP you can use it instead.
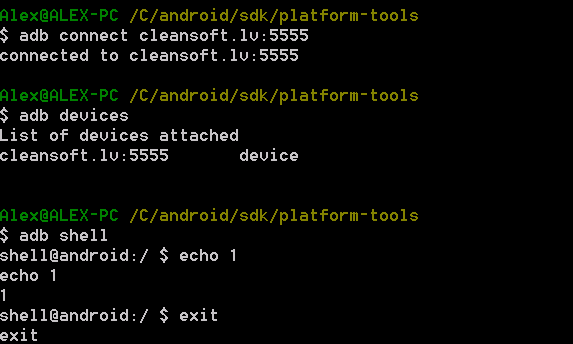
- On the remote machine execute adb connect :5555
- To make sure it works execute adb devices and look for “ :5555 device”. If you are getting offline status make sure device is not sleeping and that you have setup Android 4.2+ security.
- Test it out with adb shell
Now you are ready to open IDE on remote machine and start debugging your applications as if you have your Android device connected using USB.
Источник
Quick Guide To Remote Debugging Android 9 Pie Devices Using Chrome on Windows
Feb 19, 2020 · 4 min read
Step 1: Enable the Android Developer Options Menu
i) On your Android device, go to “Settings”. Scroll down to “ System” menu.
ii) Select “About Device” (or “About Phone”) option.
iii) Scroll down to the “Build Number” and tap on it 3 to 4 times.
iv) It will display “ You are now 3 steps away from being a developer”.
v) Once it prompts you with “ Enter your device pin to continue”. Enter your pin and click “OK” .
Step 2: Enable USB Debugging on Android Device
i) On your Android device, under “Settings” or “ System”, scroll down and open “Developer Options”.
ii) Under the “Developer Options” menu:
. Enable “USB Debugging”, when prompted to “Allow USB debugging” tap on Ok.
. You can also opt to “Enable demo mode” and “Show demo mode”.
. This enables the debug mode when the USB cable is connected.
Step 3: Connect the Android Device to the Computer
i) Connect your Android device to your computer using a data line USB cable.
ii) On your Android device, “ allow USB debugging” if you see an alert for permission.
. To prevent the alert in the future, enable the “Always allow from this computer” toggle, then tap “ OK”.
Step 4: Enable USB discovery in Chrome
i) On your computer(PC), make sure you have internet connection.
ii) Open Chrome and navigate to developer tools.
. Click the 3 dots on the top right corner, click on “More tools” .
. Scroll down and click to open “ Developer tools”.
· Alternatively using the keyboard shortcuts use Cmd + alt + i / Ctrl + shift + i
iii) Under “ Developer tools” click the 3 dots on the top right corner, scroll down to “More tools”, scroll down and click to open “Remote devices”.
iv) Under the “Remote devices” header, you will get “This panel has been deprecated in favor of the chrome://inspect/#devices interface, which has equivalent functionality.”
v) Click on it “ chrome://inspect/#devices”
Step 5: Open the URL of the page to be debugged
i) On your Android device connected to your computer, open Chrome.
ii) On the chrome://inspect/#devices Tab:
iii) Click on Devices and under Devices,
iv) Tick on “ Discover USB devices”
v) You can opt to also tick on “Discover network targets”.
vi) You should be able to see your Android Device under Remote Target.
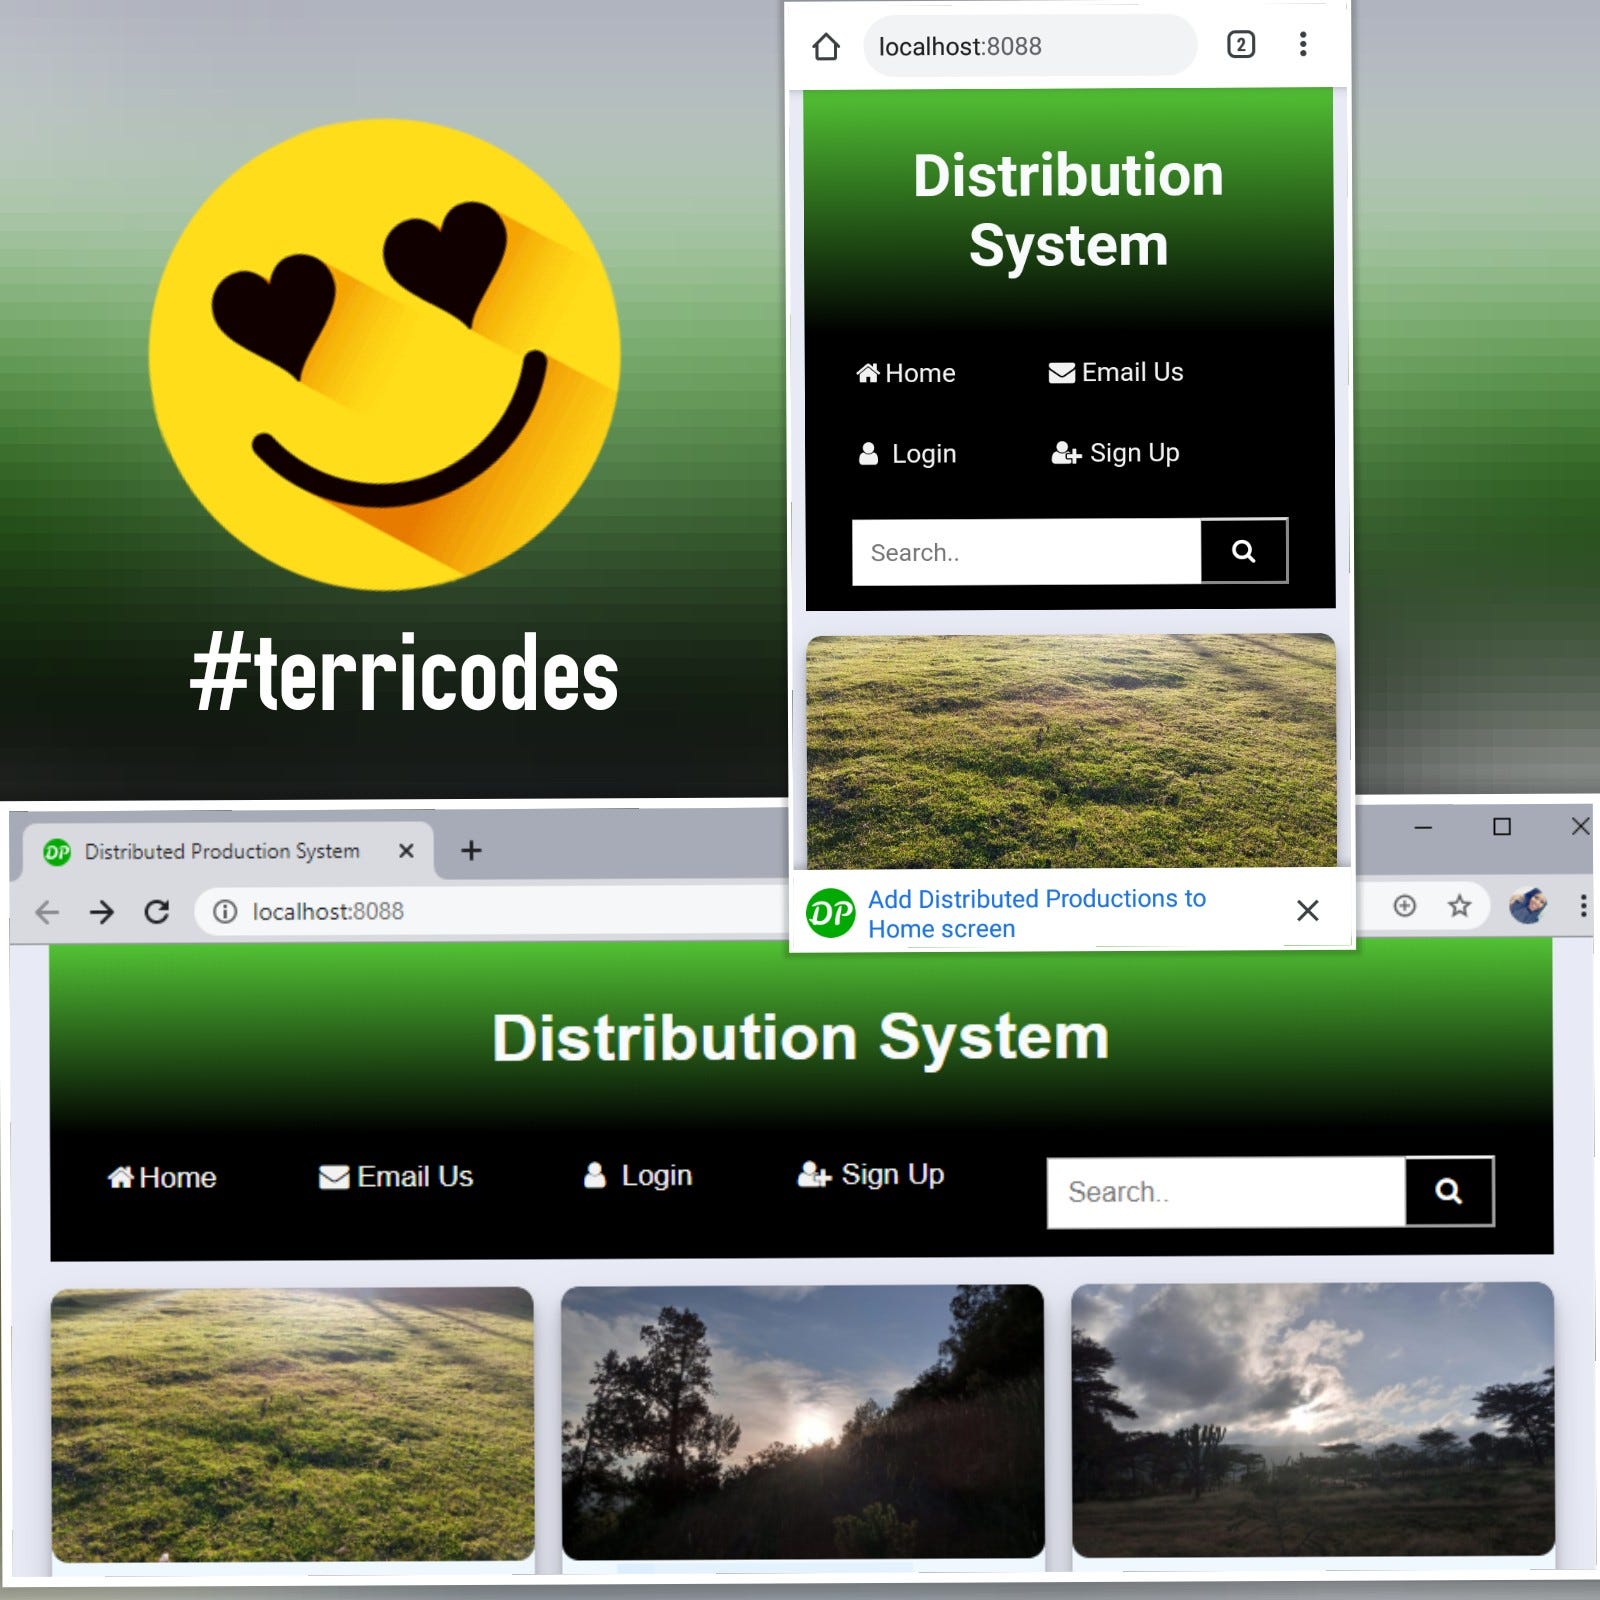
vii) Under “ Discover USB devices” click on “Port forwarding settings”. Select the Port and IP address and port and add it, eg 8088 for Port and localhost:8088 for IP address and port.
vii) Click on “Enable port forwarding” which checks the box and click “Done”.
viii) You will see “Port forwarding is active. Closing this page terminates it”, and a green dot alongside your device name, showing it’s been successfully connected.
ix) Type/paste the page you wish to inspect on “Open tab with url” and click on Open.
Step 6. Inspect the Page
i) On your computer, open Chrome and go to chrome://inspect.
ii) On the menu side bar, click the “Pages” link.
iii) Under the “Pages” heading, find the page that you want to debug.
iv) Click “Inspect” below the page title.
Источник
royshouvik / remoteDebugging.md
Remote Debugging on Android with Chrome
The way your web content behaves on mobile can be dramatically different from the desktop experience. Remote debugging with Chrome DevTools lets you debug live content on your Android device from your development machine.
Debugging Chrome for Android using the Chrome Developer Tools
Remote debugging on Android supports:
- Debugging websites in browser tabs.
- Debugging WebViews in native Android apps.
- Screencasting live to your development machine from your Android device.
- Accessing your development server on Android using port forwarding and virtual host mapping.
We are going to talk about debugging a website in a Chrome browser tab in this document. To begin remote debugging, you need:
- Chrome 32 or later installed on your development machine.
- A USB cable to connect your Android device.
- For browser debugging: Android 4.0+ and Chrome for Android.
Note: Remote debugging requires your version of desktop Chrome to be newer than the version of Chrome for Android on your device. For best results, use Chrome Canary (Mac/Windows) or the Chrome Dev channel release (Linux) on desktop and Chrome Stable on Android. This ensures the version of desktop Chrome is newer than the version of Chrome for Android.
Setting up your Android device
Follow these instructions to set up your Android device for remote debugging.
Enable USB debugging
- On your Android device, select Settings > Developer options.
Note: On Android 4.2 and later, the developer options are hidden by default. To enable the developer options, select Settings > About phone and tap Build number seven times.
In Developer options, select the USB debugging checkbox:
If an alert prompts you to allow USB debugging. Tap OK.
Connect your device
- Connect the Android device to your development machine using a USB cable.
Note: If you are developing on Windows, install the appropriate USB driver for your device. See OEM USB Drivers on the Android Developers’ site.
Discovering devices in Chrome
- After setting up remote debugging on Android, discover your device in Chrome.
- On your desktop Chrome browser, navigate to chrome://inspect. Confirm that Discover USB devices is checked.
- On your device, an alert prompts you to allow USB debugging from your computer. Tap OK.
- The message USB debugging connected displays in the device’s notification drawer.
Note: During remote debugging, Chrome prevents your device’s screen from going to sleep. This feature is useful for debugging, but is also less secure. So be sure to keep an eye on your device!
- On your computer, the chrome://inspect page displays every connected device, along with its open tabs and debug-enabled WebViews.
Debugging remote browser tabs
- From the chrome://inspect page, you can launch DevTools and debug your remote browser tabs.
- To start debugging, click inspect below the browser tab you want to debug.
- A new instance of Chrome DevTools launches on your computer. From this instance, you can interact with the selected browser tab on your device in real time.
For example, you can use DevTools to inspect web page elements on your device:
- When you mouse over an element in the Elements panel, DevTools highlights the element on your device.
- You can also click the Inspect Element inspect element icon icon in DevTools and tap your device screen. DevTools highlights the tapped element in the Elements panel.
Here are a few tips to help get you started with remote debugging:
- Use F5 (or Cmd+r on Mac) to reload a remote page from the DevTools window.
- Keep the device on a cellular network. Use the Network panel to view the network waterfall under actual mobile conditions.
- Use the Timeline panel to analyze rendering and CPU usage. Hardware on mobile devices often runs much slower than on your development machine.
- If you’re running a local web server, use port forwarding or virtual host mapping to access the site on your device.
Shifting your attention between screens isn’t always convenient. Screencast displays your device’s screen right alongside DevTools on your development machine. You can interact with the content on your device from the screencast too.
As of KitKat 4.4.3, screencast is available for both browser tabs and Android WebViews.
- To start screencasting, click the Screencast screencast icon icon in the upper right corner of your remote debugging DevTools window.
- The Screencast panel opens on the left and displays a live view of your device’s screen.
Screencast only displays page content. Transparent portions of the screencast are covered by the omnibox, device keyboard, and other device interfaces.
Note: Because screencast continuously captures frames, it has some performance overhead. If your tests are sensitive to frame rate, disable screencast.
When you interact with the screencast, clicks are translated into taps, firing proper touch events on the device. Keystrokes from your computer are sent to the device, so you can avoid typing with your thumbs.
Other DevTools work with the screencast too. For example, to inspect an element, click the Inspect Element inspect element icon icon and then click inside the screencast.
Tips: To simulate a pinch gesture, hold Shift while dragging. To scroll, use your trackpad or mouse wheel or fling with your pointer.
Port forwarding on Chrome for Android makes it easy to test your development site on mobile. It works by creating a listening TCP port on your mobile device that maps to a particular TCP port on your development machine. Traffic between these ports travels through USB, so the connection doesn’t depend on your network configuration.
To enable port forwarding:
- Open chrome://inspect on your development machine.
- Click Port Forwarding. The port forwarding settings display.
- In the Device port field, enter the port number you want your Android device to listen on. (The default port is 8080.)
- In the Host field, enter the IP address (or hostname) and port number where your web application is running.
- This address can be any local location accessible from your development machine. Currently, port numbers must be between 1024 and 32767 (inclusive).
- Check Enable port forwarding.
- Click Done.
- The port status indicators on chrome://inspect are green when port forwarding is successful.
Now you can open a new Chrome for Android tab and view the content of your local server on your device.
Источник
