- Systrace
- Requirements
- User Interface
- Command Line Usage
- Android 4.3 and higher options
- Android 4.2 and lower options
- Trace Viewing Shortcuts
- Quickstart: Record traces on Android
- Starting the tracing services
- Recording a trace
- Recording a trace through the Perfetto UI
- Recording a trace through the cmdline
- Full trace config
Systrace
The Systrace tool helps analyze the performance of your application by capturing and displaying execution times of your applications processes and other Android system processes. The tool combines data from the Android kernel such as the CPU scheduler, disk activity, and application threads to generate an HTML report that shows an overall picture of an Android device’s system processes for a given period of time.
The Systrace tool is particularly useful in diagnosing display problems where an application is slow to draw or stutters while displaying motion or animation. For more information on how to use Systrace, see Analyzing UI Performance with Systrace.
Requirements
In order to run Systrace, you must have Android SDK Tools 20 or later installed. You must also have Python installed and included in your development computer’s execution path. In order to generate a trace, you must connect a device running Android 4.1 (API Level 16) or higher to your development system using a USB debugging connection.
The Systrace tool can be run either from one of the Android SDK’s graphical user interface tools, or from the command line. The following sections describe how to run the tool using either of these methods.
User Interface
The Systrace tool can be run from the Android Developer Tools (ADT) in Eclipse, Android Studio, or the Android Device Monitor.
To run the Systrace capture user interface:
- In Eclipse, open an Android application project.
- Switch to the DDMS perspective, by selecting Window > Perspectives > DDMS.
- In the Devices tab, select the device on which to run a trace. If no devices are listed, make sure your device is connected via USB cable and that debugging is enabled on the device.
- Click the Systrace icon at the top of the Devices panel to configure tracing.
- Set the tracing options and click OK to start the trace.
- In Android Studio, open an Android application project.
- Open the Device Monitor by selecting Tools > Android > Android Device Monitor.
- In the Devices tab, select the device on which to run a trace. If no devices are listed, make sure your device is connected via USB cable and that debugging is enabled on the device.
- Click the Systrace icon at the top of the Devices panel to configure tracing.
- Set the tracing options and click OK to start the trace.
- Navigate to your SDK tools/ directory.
- Run the monitor program.
- In the Devices tab, select the device on which to run a trace. If no devices are listed, make sure your device is connected via USB cable and that debugging is enabled on the device.
- Click the Systrace icon at the top of the Devices panel to configure tracing.
- Set the tracing options and click OK to start the trace.
Command Line Usage
The Systrace tool has different command line options for devices running Android 4.3 (API level 18) and higher versus devices running Android 4.2 (API level 17) and lower. The following sections describe the different command line options for each version.
The general syntax for running Systrace from the command line is as follows.
See the sections below for example Systrace sessions.
Android 4.3 and higher options
When you use Systrace on devices running Android 4.3 and higher, you can omit trace category tags to get the defaults, or you may manually specify tags for inclusion. Here is an example execution run that sets trace tags and generates a trace from a connected device.
Tip: If you want to see the names of tasks in the trace output, you must include the sched category in your command parameters.
The table below lists the Systrace command line options for devices running Android 4.3 (API level 18) and higher.
| Option | Description |
|---|---|
| Show the help message. | |
| -o | Write the HTML trace report to the specified file. |
| -t N, —time=N | Trace activity for N seconds. The default value is 5 seconds. |
| -b N, —buf-size=N | Use a trace buffer size of N kilobytes. This option lets you limit the total size of the data collected during a trace. |
| -k —ktrace= | Trace the activity of specific kernel functions, specified in a comma-separated list. |
| -l, —list-categories | List the available tracing category tags. The available tags are:
Note: Some trace categories are not supported on all devices. Tip: If you want to see the names of tasks in the trace output, you must include the sched category in your command parameters. |
| -a —app= | Enable tracing for applications, specified as a comma-separated list of package names. The apps must contain tracing instrumentation calls from the Trace class. For more information, see Analyzing UI Performance with Systrace. |
| —from-file= | Create the interactive Systrace report from a file, instead of running a live trace. |
| -e —serial= | Conduct the trace on a specific connected device, identified by its device serial number. |
Android 4.2 and lower options
Using Systrace on the command line with devices running Android 4.2 and lower is typically a two-step process. You must first set the trace tags you want to capture and then run the trace. Here is an example execution run that sets trace tags and generates a trace from a connected device.
The table below lists the Systrace command line options for devices running Android 4.2 (API level 17) and lower.
| Option | Description |
|---|---|
| Show the help message. | |
| -o | Write the HTML trace report to the specified file. |
| -t N, —time=N | Trace activity for N seconds. The default value is 5 seconds. |
| -b N, —buf-size=N | Use a trace buffer size of N kilobytes. This option lets you limit the total size of the data collected during a trace. |
| -d, —disk | Trace disk input and output activity. This option requires root access on the device. |
| -f, —cpu-freq | Trace CPU frequency changes. Only changes to the CPU frequency are logged, so the initial frequency of the CPU when tracing starts is not shown. |
| -i, —cpu-idle | Trace CPU idle events. |
| -l, —cpu-load | Trace CPU load. This value is a percentage determined by the interactive CPU frequency governor. |
| Prevent tracing of the CPU scheduler. This option allows for longer trace times by reducing the rate of data flowing into the trace buffer. | |
| Trace the bus utilization levels. This option requires root access on the device. | |
| -w, —workqueue | Trace kernel work queues. This option requires root access on the device. |
| —set-tags= | Set the enabled trace tags in a comma separated list. The available tags are:
Note: When setting trace tags from the command line, you must stop and restart the framework ( $ adb shell stop; adb shell start ) for the tag tracing changes to take effect. You can set the trace tags for Systrace on your Android 4.2 and lower device by navigating to Settings > Developer options > Monitoring > Enable traces. Trace Viewing ShortcutsThe table below lists the keyboard shortcuts that are available while viewing a Systrace trace HTML report. Источник Quickstart: Record traces on AndroidPerfetto allows you to collect system-wide performance traces from Android devices from a variety of data sources (kernel scheduler via ftrace, userspace instrumentation via atrace and all other data sources listed in this site). Starting the tracing servicesPerfetto is based on platform services that are avilable since Android 9 (P) but are enabled by default only since Android 11 (R). On Android 9 (P) and 10 (Q) you need to do the following to ensure that the tracing services are enabled before getting started: # Needed only on Android 9 (P) and 10 (Q) on non-Pixel phones. adb shell setprop persist.traced.enable 1 If you are running a version of Android older than P, you can still capture a trace with Perfetto using the record_android_trace script. See instructions below in the Recording a trace through the cmdline section. Recording a traceCommand line tools (usage examples below in this page):
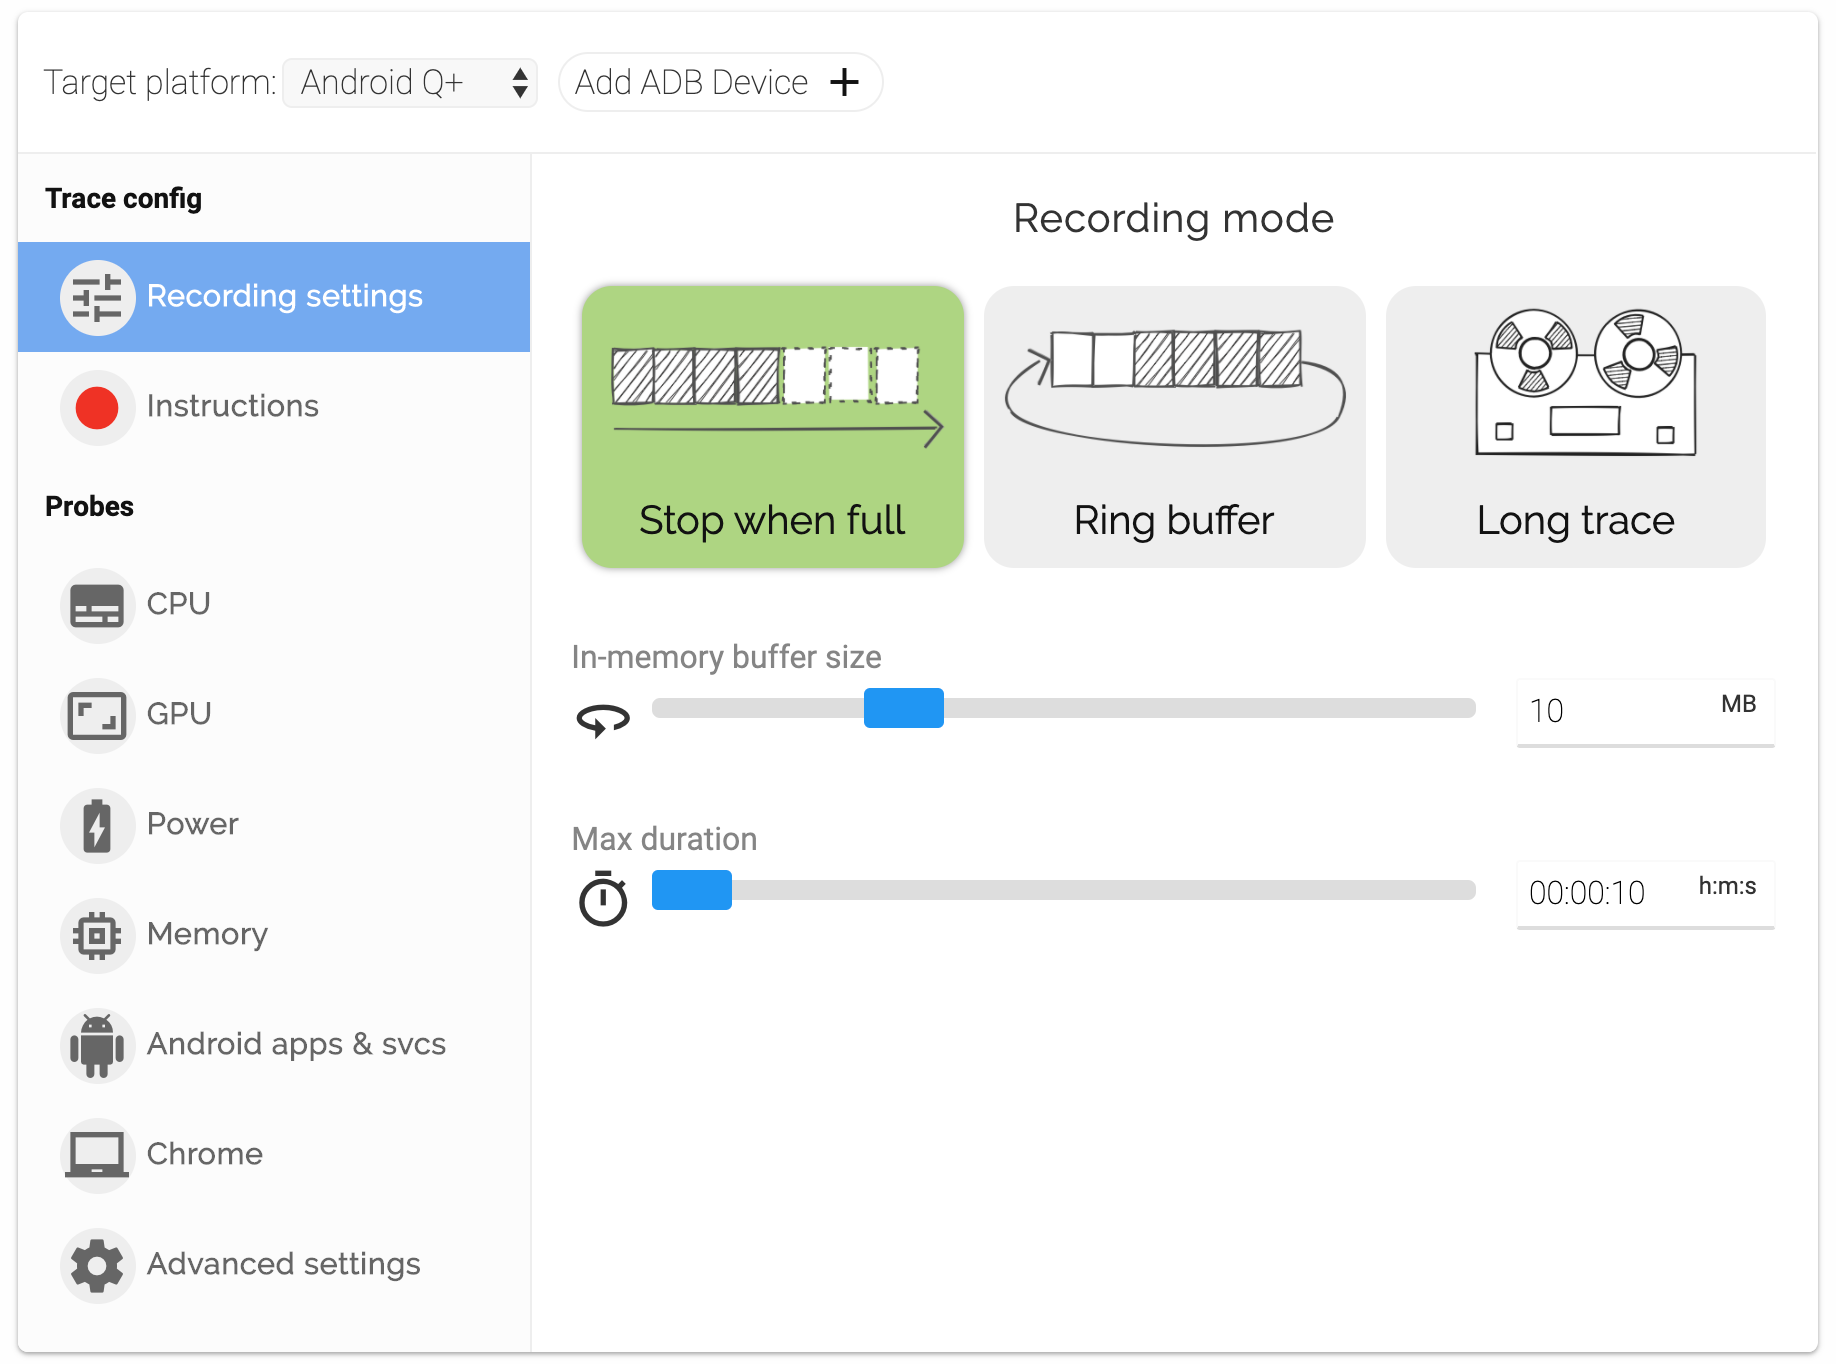
Recording a trace through the Perfetto UINavigate to ui.perfetto.dev and select Record new trace from the left menu. From this page, select and turn on the data sources you want to include in the trace. More detail about the different data sources can be found in the Data sources section of the docs.
If you are unsure, start by turning on Scheduling details under the CPU tab. Ensure your device is connected and select Add ADB device. Once your device has successfully paired (you may need to allow USB debugging on the device), select the Start Recording button. Allow time for the trace to be collected (10s by default) and then you should see the trace appear.
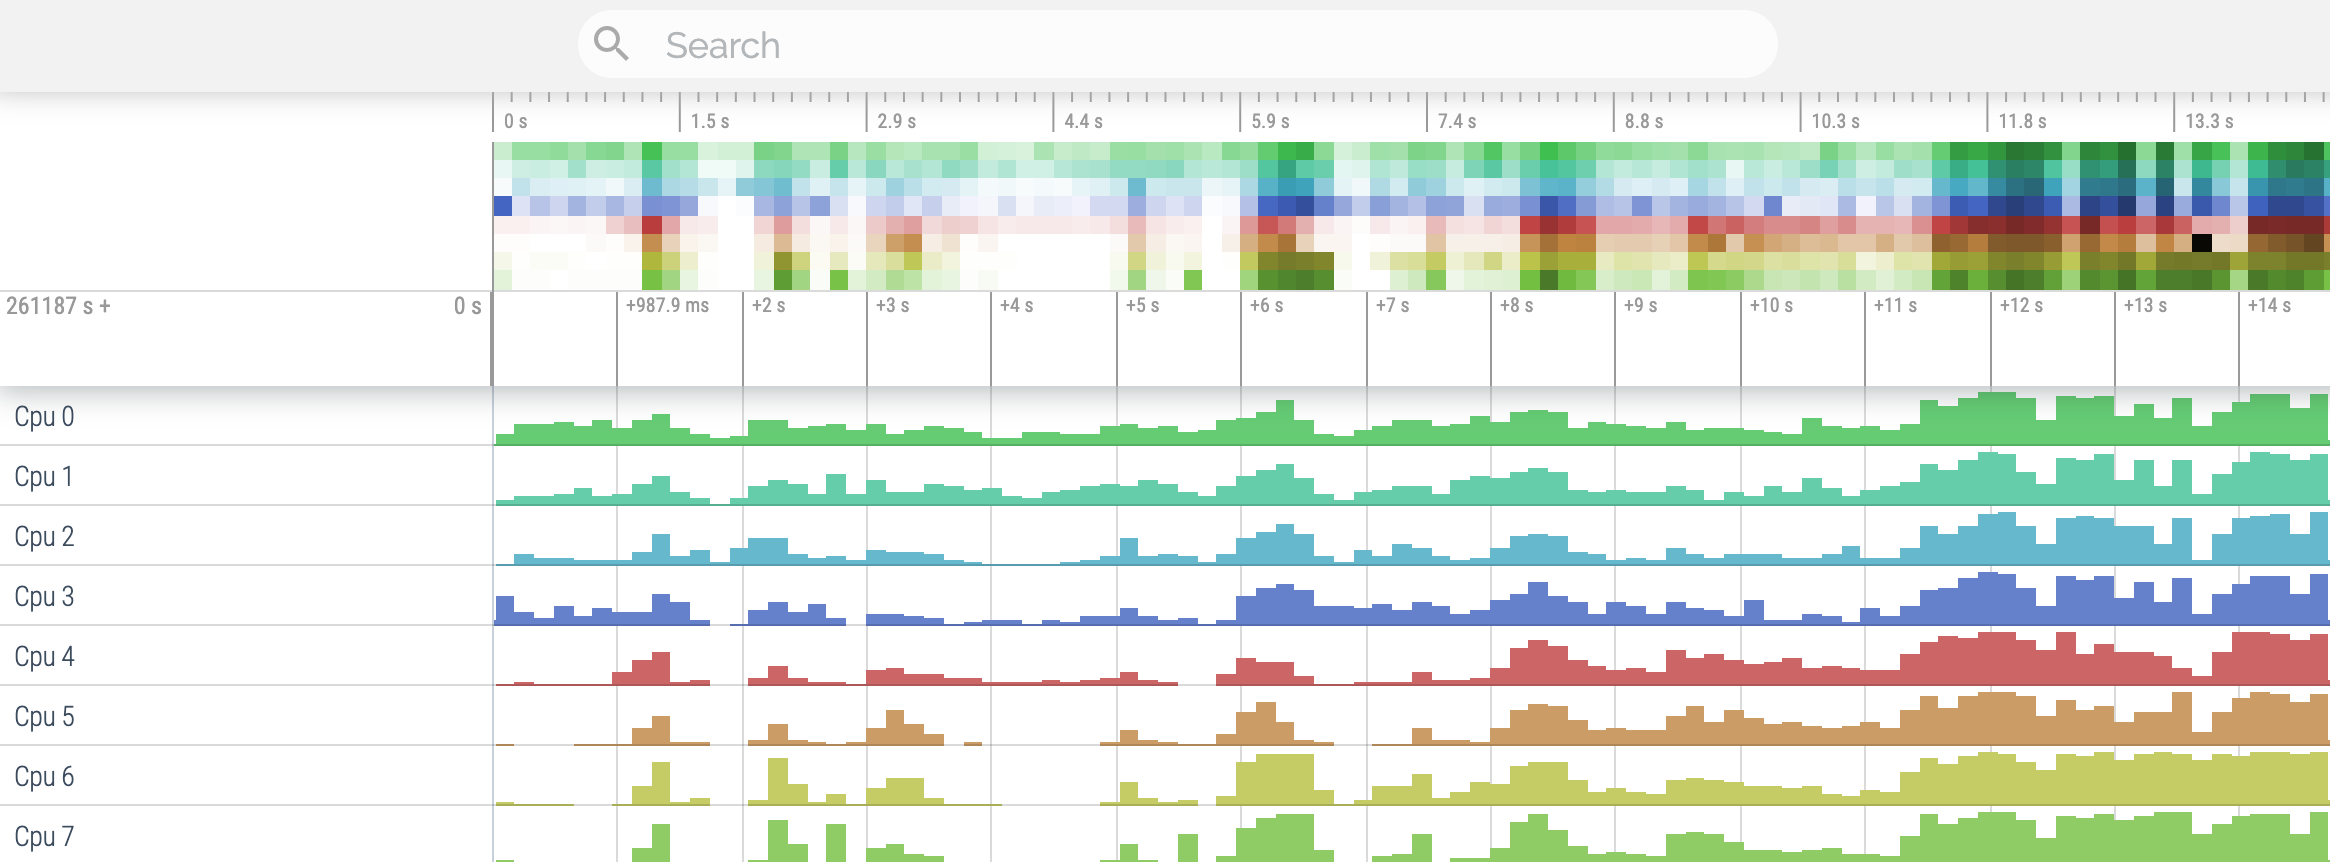
Your trace may look different depending on which data sources you enabled. Recording a trace through the cmdlinePrerequisites For the cmdline based workflow you will need the adb (Android Debug Bridge) executable to be in your PATH. ADB binaries for Linux, Mac or Windows can be downloaded from https://developer.android.com/studio/releases/platform-tools . Using the helper script We suggest using the tools/record_android_trace script to record traces from the command line. It is the equivalent of running adb shell perfetto but it helps with getting the paths right, auto-pulling the trace once done and opening it on the browser. Furthermore, on older versions of Android it takes care of sideloading the tracebox binary to make up for the lack of tracing system services. If you are already familiar with systrace or atrace , both cmdline tools support a systrace-equivalent syntax: On Linux and Mac: curl -O https://raw.githubusercontent.com/google/perfetto/master/tools/record_android_trace chmod u+x record_android_trace # See ./record_android_trace —help for more ./record_android_trace -o trace_file.perfetto-trace -t 10s -b 32mb \ sched freq idle am wm gfx view binder_driver hal dalvik camera input res memory curl -O https://raw.githubusercontent.com/google/perfetto/master/tools/record_android_trace python3 record_android_trace -o trace_file.perfetto-trace -t 10s -b 32mb \ sched freq idle am wm gfx view binder_driver hal dalvik camera input res memory Using the on-device /system/bin/perfetto command Or, if you want to use directly the on-device binary do instead: adb shell perfetto -o /data/misc/perfetto-traces/trace_file.perfetto-trace -t 20s \ sched freq idle am wm gfx view binder_driver hal dalvik camera input res memory Caveats when using directly the adb shell perfetto workflow:
Full trace configThe short syntax allows to enable only a subset of the data sources; for full control of the trace config, pass the full trace config in input. See the Trace configuration page and the examples in each data source doc page for detailed instructions about how to configure all the various knobs of Perfetto. If you are running on a Mac or Linux host, or are using a bash-based terminal on Windows, you can use the following: WARNING: The below command does not work on Android P because the —txt option was introduced in Q. The binary protobuf format should be used instead; the details of this can be found on the Trace configuration page. Or alternatively, when using directly the on-device command: cat config.pbtx | adb shell perfetto -c — —txt -o /data/misc/perfetto-traces/trace.perfetto-trace Alternatively, first push the trace config file and then invoke perfetto: adb push config.pbtx /data/ local /tmp/config.pbtx adb shell ‘cat /data/local/tmp/config.pbtx | perfetto —txt -c — -o /data/misc/perfetto-traces/trace.perfetto-trace’ NOTE: because of strict SELinux rules, on non-rooted builds of Android, passing directly the file path as -c /data/local/tmp/config will fail, hence the -c — + stdin piping above. From Android 12 (S), /data/misc/perfetto-configs/ can be used instead. Pull the file using adb pull /data/misc/perfetto-traces/trace /trace.perfetto-trace and open it in the Perfetto UI. NOTE: On devices before Android 10, adb cannot directly pull /data/misc/perfetto-traces . Use adb shell cat /data/misc/perfetto-traces/trace > trace.perfetto-trace to work around. The full reference for the perfetto cmdline interface can be found here. Except as otherwise noted, the content of this page is licensed under the Creative Commons Attribution 4.0 License, and code samples are licensed under the Apache 2.0 License. Java is a registered trademark of Oracle and/or its affiliates. Источник  Когда к мобильному устройству присоединены наушники  ОС Google Android развивается, и по всему видимому |