- Attaching MonoDevelop Debugger To An Android Device
- Android environment setup
- 1. Install Android Build Support and the Android SDK & NDK tools
- 2. Enable USB debugging on your device
- ADB debugging for Chrome OS devices
- Connecting to your Chrome OS device
- Customizing the Android SDK & NDK Tools and OpenJDK installation
- Change the OpenJDK path
- Change the Android SDK Tools path
- Change the Android NDK path
- Updating the Android SDK Target API
- Debugging C# code in Unity
- Configuring the code editor
- Visual Studio (Windows)
- Visual Studio for Mac
- JetBrains Rider
- VS Code
- Specifying the External Script Editor in Unity
- Debugging in the Editor
- Setting breakpoints and attaching to the Editor
- Debugging in the Player
- Debugging on Android and iOS devices
- Android
- Android on Chrome OS
- Troubleshooting the debugger
- Ensure you attach the debugger to the correct Unity instance
- Verify the network connection to the Unity instance
- Ensure the device has only one active network interface
- Check the firewall settings
- Verify the managed debugging information is available
- Prevent the device from locking
Attaching MonoDevelop Debugger To An Android Device
You can attach the MonoDevelop debugger to an Android device with ADB via TCP/IP. The process is described below.
Enable “USB debugging” on your device and connect the device to your development machine via USB cable. Ensure your device is on the same subnet mask and gateway as your development machine. Also, make sure there are no other active network connections on the device, i.e. disable data access over mobile/cellular network.
On your development machine, open up your terminal/cmd and navigate to the location of the ADB. You can find the ADB tool in /platform-tools/
Restart host ADB in TCP/IP mode with the following command:
This will have enabled ADB over TCP/IP using port 5555. If port 5555 is unavailable, you should use a different port (see ADB.) The following output should be produced:
- Find out the IP address of your Android device (Settings ->About ->Status) and input the following command:
DEVICEIPADDRESS is the actual IP address of your Android device. This should produce the following output:
- Ensure that your device is recognised by inputting the following command:
This should produce the following output:
Build and run your Unity application to the device. Ensure you build your application with Development Build flag enabled and Script Debugging turned on.
Disconnect the USB cable as the device no longer needs to be connected to your development machine.
Finally, while the application is running on your device, open your script in MonoDevelop, add a breakpoint, select “Run” -> “Attach to Process” and select your device from the list. (It might take a few seconds for the device to appear in the list. It may not appear in the list if the application is not running or if the device’s display goes to sleep).
For some more details and for troubleshooting, see the Wireless Usage section in the Android developers guide for the ADB.
Note: The device sends multicast messages and the editor and MonoDevelop subscribe/listen for them. For the process to work, your network will need to be setup correctly for Multicasting.
Is something described here not working as you expect it to? It might be a Known Issue. Please check with the Issue Tracker at issuetracker.unity3d.com.
Copyright © 2017 Unity Technologies. Publication: 5.6-001N. Built: 2017-07-12.
Источник
Android environment setup
To build and run for Android, you must install the Unity Android Build Support platform module. You also need to install the Android Software Development Kit (SDK) and the Native Development Kit (NDK) to build and run any code on your Android device. By default, Unity installs a Java Development Kit based on OpenJDK.
Note: Unity supports Android 4.4 “KitKat” and above. See AndroidSdkVersions for details.
1. Install Android Build Support and the Android SDK & NDK tools
Use the Unity Hub to install Android Build Support and the required dependencies
See in Glossary : Android SDK & NDK tools, and OpenJDK.
 Add Android modules
You can install Android Build Support, the Android SDK & NDK tools and OpenJDK when you install the Unity Editor, or add them at a later time.
For information on adding the Android modules:
If you are using a 2018 version of Unity, see the Unity 2018.4 documentation for information on manually installing these dependencies.
2. Enable USB debugging on your device
To enable USB debugging, you must enable Developer options on your device. To do this, find the build number in your device’s Settings menu. The location of the build number varies between devices; for stock Android, it’s usually Settings > About phone > Build number. For specific information on your device and Android version, refer to your hardware manufacturer.
After you navigate to the build number using the instructions above, tap on the build number seven times. A pop-up notification saying “You are now X steps away from being a developer” appears, with “X” being a number that counts down with every additional tap. On the seventh tap, Developer options are unlocked.
Note: On Android versions prior to 4.2 (Jelly Bean), the Developer options are enabled by default.
Go to Settings > Developer options (or, if this does not work, on some devices the path is Settings > System > Developer options), and check the USB debugging checkbox. Android now enters debug mode when it is connected to a computer via USB.
Connect your device to your computer using a USB cable. If you are developing on a Windows computer, you might need to install a device-specific USB driver. See the manufacturer website for your device for additional information.
The setup process differs for Windows and macOS and is explained in detail on the Android developer website. For more information on connecting your Android device to the SDK, refer to the Run Your App section of the Android Developer documentation.
ADB debugging for Chrome OS devices
For information on how to set up your development environment for Chrome OS devices, and enable ADB An Android Debug Bridge (ADB). You can use an ADB to deploy an Android package (APK) manually after building. More info
See in Glossary debugging, see Google’s documentation on Chrome OS Developer Environments.
Connecting to your Chrome OS device
Before you can deploy to your device you need to manually connect with ADB via the device’s IP address.
To begin you need the IP address. Open up the Settings app and choose Network in the sidebar. Next click on the active network interface.
If the interface is wireless then next choose the SSID that you are connected to. In the details you will see your IP address. Make a note of it.
If you are using a wired connection your IP address will be shown on the first details page.
Now we are ready to connect. For the sake of this example let’s say that the device’s IP is 192.168.0.100. In a shell or terminal run the following command
adb connect 192.168.0.100
If the connection was successful you will see a message such as connected to 192.168.0.65:5555 . And adb devices should verify that the device is connected. List of devices attached 192.168.0.65:5555 device
From now on you may run ADB commands to target the device just as you would over a USB connection.
Note: If your device or host machine goes to sleep or loses network connectivity you may need to reconnect.
Customizing the Android SDK & NDK Tools and OpenJDK installation
Unity recommends that you use the Unity Hub to install Android SDK & NDK tools, to ensure that you receive the correct versions and configuration. Unity installs Android SDK & NDK Tools and OpenJDK respectively in the SDK, NDK and OpenJDK folders under /Unity/Hub/Editor/[EditorVersion]/Editor/Data/PlaybackEngines/AndroidPlayer/.
If you have multiple versions of Unity with the same required dependencies (be sure to check System requirements for the latest) and you want to avoid duplicating the installation of Android SDK & NDK Tools and OpenJDK, you can specify a shared location in the Unity Preferences window. To do this, go to Preferences > External tools and enter the directory paths in the SDK and NDK fields:
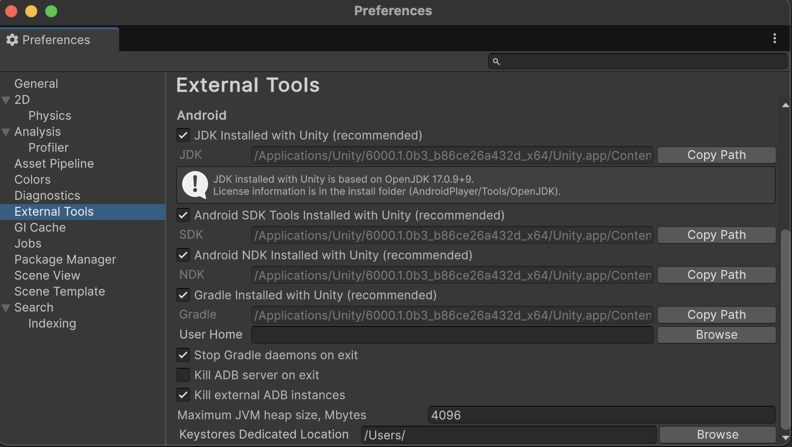 Preferences window showing external tools settings for Android
Warning: Unity does not officially support versions of the OpenJDK, SDK, or NDK other than the ones it supplies.
To change the OpenJDK, SDK Tools, or NDK that Unity uses to build Android apps:
- Open the Project.
- Open the Preferences window (Windows and Linux: Edit >Preferences; macOS: Unity >Preferences).
- In the left navigation column, select External Tools.
Change the OpenJDK path
- Uncheck JDK Installed with Unity (recommended).
- In the JDK field, enter the path to the JDK installation folder, or use the Browse button to locate it.
Change the Android SDK Tools path
- Uncheck Android SDK Tools Installed with Unity (recommended).
- In the SDK field, enter the path to the SDK installation folder, or use the Browse button to locate it.
Unity works with the most recent version of the Android SDK available at the time of the Unity version release.
Change the Android NDK path
- Uncheck Android NDK Installed with Unity (recommended).
- In the NDK field, enter the path to the NDK installation folder, or use the Browse button to locate it.
Each version of Unity requires a specific version of the Android NDK to be installed:
| Unity version | NDK version |
|---|---|
| 2018.4 LTS | r16b |
| 2019.4 LTS | r19 |
| 2020.3 LTS | r19 |
See the System requirements page for a complete list of requirements.
Updating the Android SDK Target API
Unity Hub installs the latest version of the Android SDK Target API required by Google Play.
If you need to use a more recent version, you can change the Target API from the Target API Level field in the Player Settings window (menu: Edit > Project Settings > Player, then select the Android platform). You can find the Target API Level option in the Other Settings > Identification section.
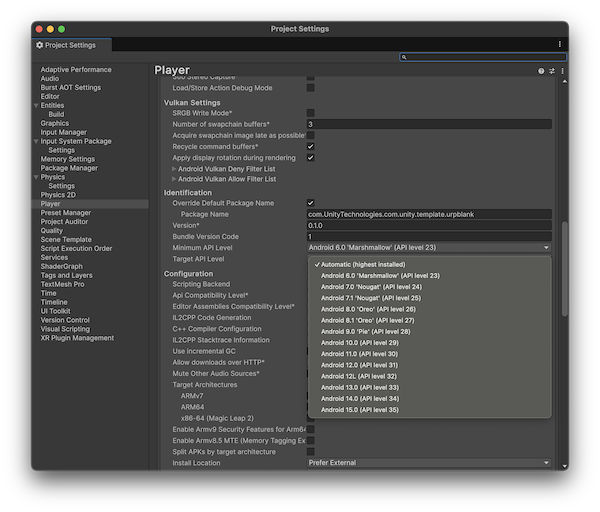 Selecting a target API for the Android SDK
After you select an option other than the default, Unity prompts you to update the Android SDK API. You can choose to either:
- Update the Android SDK
- Continue to use the highest installed version of the Android SDK
Note: If you select an older version of the Target API, the Unity Android SDK Updater will not be able to perform the update and will give you this message:
Android SDK does not include your Target SDK of (version). Please use the Android SDK Manager to install your target SDK version. Restart Unity after SDK installation for the changes to take effect.
In this case, to update the Android SDK Target API, you must use the Android sdkmanager from either Android Studio or the command line tool. Regardless of the method you chose, make sure to select the correct Android SDK folder for Unity in the Edit > Preferences > External Tools window.
On Windows, if the Unity Editor is installed in the default folder ( /Program Files/ ), you must run the sdkmanager with elevated privilege (Run as Administrator) to perform the update.
Источник
Debugging C# code in Unity
Using a debugger allows you to inspect your source code while your application or game is running. Unity supports debugging of C# code using the following code editors:
Visual Studio (with the Visual Studio Tools for Unity plug-in)
Visual Studio for Mac
Visual Studio Code
Although these code editors vary slightly in the debugger features they support, all provide basic functionality like break points, single stepping, and variable inspection.
Managed code debugging in Unity works on all platforms except WebGL A JavaScript API that renders 2D and 3D graphics in a web browser. The Unity WebGL build option allows Unity to publish content as JavaScript programs which use HTML5 technologies and the WebGL rendering API to run Unity content in a web browser. More info
See in Glossary . It works with both the Mono and IL2CPP A Unity-developed scripting back-end which you can use as an alternative to Mono when building projects for some platforms. More info
See in Glossary scripting backends A framework that powers scripting in Unity. Unity supports three different scripting backends depending on target platform: Mono, .NET and IL2CPP. Universal Windows Platform, however, supports only two: .NET and IL2CPP. More info
See in Glossary .
Configuring the code editor
Visual Studio (Windows)
The Unity Editor installer includes an option to install Visual Studio with the Visual Studio Tools for Unity plug-in A set of code created outside of Unity that creates functionality in Unity. There are two kinds of plug-ins you can use in Unity: Managed plug-ins (managed .NET assemblies created with tools like Visual Studio) and Native plug-ins (platform-specific native code libraries). More info
See in Glossary . This is the recommended way to set up Visual Studio for debugging with Unity.
If Visual Studio is already installed on your computer, use its Tools > Get Tools and Features… menu to locate and install the Visual Studio Tools for Unity plug-in.
Visual Studio for Mac
The Unity Editor installer includes an option to install Visual Studio for Mac. This is the recommended way to set up Visual Studio for Mac for debugging with Unity.
If Visual Studio for Mac is already installed on your computer, use its Extension Manager to locate and install the Visual Studio Tools for Unity plug-in.
JetBrains Rider
The default installation of JetBrains Rider can debug code in Unity on Windows or Mac. Please visit the JetBrains website to install it.
VS Code
VS Code requires you to install an extension to debug code in Unity. Please follow the instructions specific to this extension to install it.
Specifying the External Script Editor in Unity
Once you’ve installed a code editor, go to Preferences > External Tools and set the External Script Editor to your chosen code editor.

Debugging in the Editor
You can debug C# code that is running in the Unity Editor while the Unity Editor is in Play Mode.
To debug in the Editor, you need to set the Editor’s Code Optimization mode to Debug Mode, then you can attach a code editor with a debugging feature.
To change the Code Optimization mode, select the Debug Button in the bottom right of the Unity Editor Status Bar.
The Debug Button in the bottom right of the Unity Editor Status Bar
Unity’s Code Optimization setting has two modes.
- Debug Mode, which you can use to attach external debugger software, but gives slower C# performance when you run your Project in Play Mode in the Editor.
- Release Mode, which gives faster C# performance when you run your Project in Play Mode in the Editor, but you cannot attach any external debuggers.
When you click the Debug button in the status bar, a small pop-up window opens which contains a button you can use to switch modes. It also displays information about the current mode, and describes what happens if you switch modes.
 The Debug Mode popup, which shows the current mode, allows you to switch modes, and describes what happens if you switch mode.
To change which mode the Unity Editor starts up in, go to Edit > Preferences > General > Code Optimization On Startup.
 In Preferences, you can change the Code Optimization mode that Unity starts in.
You can also override the mode that the Editor starts up in, or turn off the debugger listen socket. To do this, use the following command line arguments when you launch the Editor:
- -releaseCodeOptimization Starts the Editor in release code optimization mode.
- -debugCodeOptimization Starts the Editor in debug code optimization mode.
- -disableManagedDebugger Starts the Editor with the debugger listen socket disabled.
Setting breakpoints and attaching to the Editor
In your external code editor, set a breakpoint in the code editor on a line of script code where the debugger should stop. For example, in Visual Studio, click on the column to the left of your code, on the line you want to stop the debugger (as shown below). A red circle appears next to the line number and the line is highlighted.
 A breakpoint set in Visual Studio
Next, attach the code editor to the Unity Editor. This option varies depending on the code editor, and is often a different option from the code editor’s normal debugging process. In Visual Studio, the option looks like this:
 The Attach To Unity button in Visual Studio
Some code editors may allow you to select an instance of Unity to debug. For example, in Visual Studio, the Debug > Attach Unity Debugger option exposes this capability.
 Visual Studio listing the current instances of Unity available to debug. In this example, there is one instance running in the Editor and one instance running as an Android Plyaer
When you have attached the code editor to the Unity Editor, return to the Unity Editor and enter Play Mode. When the code at the breakpoint is executed, the debugger will stop, for example:
 The debugger in Visual Studio when it has stopped at a breakpoint
While the code editor is at a breakpoint, you can view the contents of variables step by step. The Unity Editor will be unresponsive until you choose the continue option in the debugger, or stop debugging mode.
Debugging in the Player
To debug script code running in a Unity Player, ensure that you enable the “Development Build” and ”Script Debugging” options before you build the Player (these options are located in File > Build Settings). Enable the “Wait For Managed Debugger” option to make the Player wait for a debugger to be attached before it executes any script code.

To attach the code editor to the Unity Player, select the IP address (or machine name) and port of your Player. In Visual Studio, the drop-down menu on the “Attach To Unity” option looks like this:

The Debug > Attach Unity Debugger option looks like this:

Make sure you attach the debugger to the Player, and not to the Unity Editor (if both are running). When you have attached the debugger, you can proceed with debugging normally.
Debugging on Android and iOS devices
Android
When debugging a Player running on an Android device, connect to the device via USB or TCP. For example, to connect to an Android device in Visual Studio (Windows), select Debug > Attach Unity Debugger option. A list of devices running a Player instance will appear:

In this case, the phone is connected via USB and Wi-Fi on the same network as the workstation running the Unity Editor and Visual Studio.
Android on Chrome OS
Unity cannot automatically discover Chrome OS devices. To initiate a connection, connect to the device through Android Debug Bridge (adb) by its IP address and then enter the IP address manually in the debugger dialog.
When debugging a Player running on an iOS device, connect to the device via TCP. For example, to connect to an iOS device in Visual Studio (Mac), select Debug > Attach Unity Debugger option. A list of devices running a Player instance will appear:

Ensure that the device only has one active network interface (Wi-Fi recommended, turn off cellular data) and that there is no firewall between the IDE and the device blocking the TCP port (port number 56000 in the above screenshot). Debugging over USB is not supported with iOS Apple’s mobile operating system. More info
See in Glossary .
Troubleshooting the debugger
Most problems with the debugger occur because the code editor is unable to locate the Unity Editor or the Player. This means that it can’t attach the debugger properly. Because the debugger uses a TCP connection to the Editor or Player, connection issues are often caused by the network. Here are a few steps you can take to troubleshoot basic connection issues.
Ensure you attach the debugger to the correct Unity instance
You can attach code editor to any Unity Editor or Unity Player on the local network that has debugging enabled. When attaching the debugger to ensure that you are attaching to the correct instance. If you know the IP address or machine name of the device on which you are running the Unity Player, this helps to locate the correct instance.
Verify the network connection to the Unity instance
The code editor uses the same mechanism to locate a Unity instance to debug as the Unity Profiler A window that helps you to optimize your game. It shows how much time is spent in the various areas of your game. For example, it can report the percentage of time spent rendering, animating, or in your game logic. More info
See in Glossary uses. If the code editor cannot find the Unity instance you expect it to find, try to attach the Unity Profiler to that instance. If the Unity Profiler cannot find it either, a firewall might exist on the machine which you are running the code editor on or the machine which you are running the Unity instance on (or possibly both). If a firewall is in place, see the information about firewall settings below.
Ensure the device has only one active network interface
Many devices have multiple network interfaces. For example, a mobile phone may have both an active cellular connection and an active Wi-Fi connection. To properly connect the debugger for TCP, the IDE needs to make a network connection to the correct interface on the device. If you plan to debug via Wi-Fi, for example, make sure you put the device in airplane mode to disable all other interfaces, then enable Wi-Fi.
You can determine which IP address the Unity Player is telling the IDE to use by looking in the Player Log The .log file created by a Standalone Player that contains a record of events, such as script execution times, the compiler version, and AssetImport time. Log files can help diagnose problems. More info
See in Glossary . Look for a part of the log like this:
This message indicates the IDE will try to use the IP address 10.0.1.152 and port 56000 to connect to the device. This IP address and port must be reachable from the computer running the IDE.
Check the firewall settings
The Unity instance communicates with the code editor via a TCP connection. On most Unity platforms, this TCP connection occurs on an arbitrarily chosen port. Normally, you should not need to know this port, as the code editor should detect it automatically. If that does not work, try to use a network analysis tool to determine which ports might be blocked either on the machine where you are running the code editor, or the machine or device where you are running the Unity instance. When you find the ports, make sure that your firewall allows access to both the port on the machine running the code editor, and the machine running the Unity instance.
Verify the managed debugging information is available
If the debugger does attach, but breakpoints don’t load, the debugger may not be able to locate the managed debugging information for the code. Managed code debugging information is stored in files named .pdb, next to the managed assembly (.dll file) on disk.
When the correct preferences and build options are enabled (see above, Unity will generate this debugging information automatically. However, Unity cannot generate this debugging information for managed plugins in the Project. It is possible to debug code from managed plugins if the associated .pdb files are next to the managed plugins in the Unity project on disk.
Prevent the device from locking
If the device you are using to debug the application has a screen lock, make sure this is disabled. Screen locks cause the debugger to disconnect, and prevent it from re-connecting. It is best to avoid locking the screen during managed code debugging. If the screen does lock, you should restart the application on the device before the debugger can connect again.
Источник


